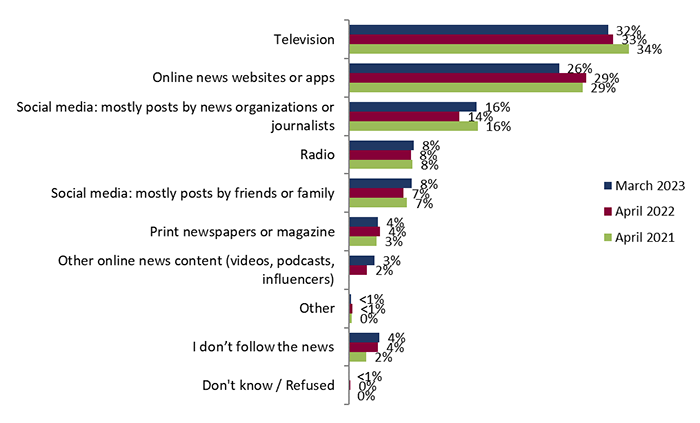
Around one-third of electors in March 2023 turned to television (32%) and one-fourth turned to online news websites or apps (26%) as their main source of news. Posts by news organizations and journalists on social media were the third most popular medium (16%). Less than one in 10 electors preferred radio (8%), posts by friends or family on social media (8%), print newspapers or magazines (4%), and other online news content (3%). The proportion of electors who stated their main source of news is online news websites or apps decreased significantly since April 2022.
Figure 1: Main source of news
Q: In general, which of these would you say is your main source of news? MULTIPLE ANSWERS ALLOWED * Base: All respondents (n=2,505).
Text version of "Figure 1: Main source of news"
This graph shows the main source of news for respondents. The breakdown is as follows:
2023:
Television: 32%;
Online news websites or apps: 26%;
Social media, mostly posts by news organizations or journalists: 16%;
Radio: 8%;
Social media, mostly posts by friends or family: 8%;
Print newspapers or magazines: 4%;
Other online news content such as videos, podcasts, influencers: 3%;
Other: 0%;
I don't follow the news: 4%;
Don't know or refused: <1%
2022:
Television: 33%;
Online news websites or apps: 29%;
Social media, mostly posts by news organizations or journalists: 14%;
Radio: 8%;
Social media, mostly posts by friends or family: 7%;
Print newspapers or magazine: 4%;
Other online news content such as videos, podcasts, influencers: 2%;
Other: 0%;
I don't follow the news: 4%;
Don't know or refused: 0%.
2021:
Television: 34%;
Online news websites or apps: 29%;
Social media, mostly posts by news organizations or journalists: 16%;
Radio: 8%;
Social media, mostly posts by friends or family: 7%;
Print newspapers or magazine: 3%;
Other online news content such as videos, podcasts, influencers: no data;
Other: 0%;
I don't follow the news: 4%;
Don't know or refused: 0%.
Notable subgroup differences regarding March 2023 respondents' main source of news include the following:
Men were more likely to turn to online news (31% versus 21% among women), while women were more likely to turn to social media posts by news organizations or journalists (18% versus 14% among men), or by friends or family (10% versus 5%).
Electors aged 18 to 34 were more likely to favour social media posts by friends or family (18% versus 2% among those over 55 years old) as well as social media posts by news organizations and journalists (31% versus 6% among those aged 55+). On the other hand, those aged 35 to 54 more often preferred online news websites or apps (31% versus 23% among 18 to 34-year-olds), while respondents aged 55 and older were more likely to turn to television (51% versus 9% among those 18–34 and 27% among those 35–54) or print newspapers or magazines (7% versus 2% and 1% among 35 to 54 and 18 to 34-year-old respondents respectively).
Respondents from Quebec were more likely to turn to television (39%), while respondents from Ontario were more likely to turn to online news websites or apps (29%) compared with those from other parts of Canada.
Electors with some amount of university education were more likely to prefer online news websites or apps (32%), while those with some college or trade school (21%) and those with a high school education or less (18%) were less likely.
Respondents with a high school education or less (38%) as well as those with some college or trade school education (35%) were more likely to turn to television, while those with some amount of university (28%) were less likely.
Indigenous electors were more likely to state that posts by friends or family on social media were their main source of news (17%), along with online news websites or apps (37% versus 25% among non-Indigenous respondents).
Respondents who were interested in politics were more likely to turn to online news websites or apps (28%) compared to those who were not (21%).
Habitual voters were more likely to turn to television (36% versus 21%), while infrequent voters were more likely to prefer social media posts by friends or family (14% versus 6% among habitual voters) or by news organizations (20% versus 14%).1
Respondents who held no conspiracy beliefs were more likely to turn to online news websites and apps (31%), while those who held strong conspiracy beliefs were more likely to turn to posts by friends and family on social media as their main source of news (11%).
Respondents who often saw news about Canadian politics were more likely to state that television (35%) and online news websites or apps (28%) were their main sources of news, while those who rarely saw news about politics from any origin were more likely to turn to the radio (13%) or social media posts by friends and family (19%) as their main sources of news. Those who often see news about U.S./world politics but rarely see news about Canadian politics were more likely to indicate social media posts by friends and family as their main source of news (15%), and less likely to mention television (16%).
News origin
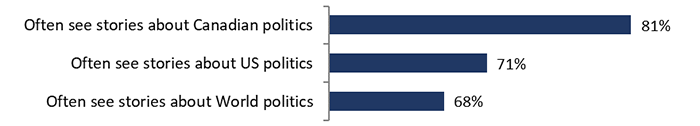
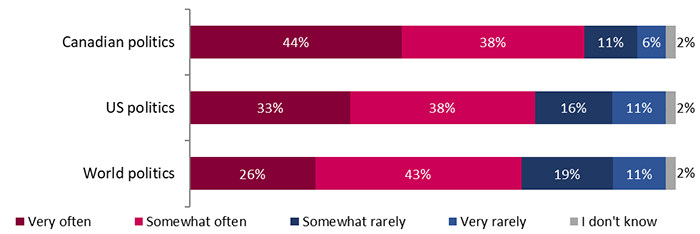
When thinking about their main source of news, 81% of respondents said they often see stories covering Canadian politics, including 44% who said very often. 71% said they often see stories covering U.S. politics (33% very often), and 68% said they often see stories covering world politics (26% very often).
Among the 17% of respondents who rarely see news about Canadian politics, respondents were further grouped based on whether or not they often see news about politics of any origin, as follows:
5% said they often see news about U.S./world politics but rarely see news about Canadian politics.
11% said they rarely see news about politics from any origin.
Figure 2: Frequency of exposure to news stories covering Canadian, U.S., and world politics – topline results
Q: Thinking about your main source of news, how often do you see stories covering Canadian politics, U.S. politics, or politics from the rest of the world? Base: All respondents (n=2,505).
Note: Newly added question, no comparison available.
Note: For analysis purposes, a net often (very + somewhat often) has been calculated.
Text version of "Figure 2: Frequency of exposure to news stories covering Canadian, U.S., and world politics – topline results"
This graph shows the frequency of exposure to news stories covering Canadian, U.S., and world politics. The distribution is as follows:
Canadian politics: 81%;
U.S. politics: 71%;
World politics: 68%.
Figure 3: Frequency of exposure to news stories covering Canadian, U.S., and world politics – detailed March 2023 results
Q: Thinking about your main source of news, how often do you see stories covering Canadian politics, U.S. politics, or politics from the rest of the world? Base: All respondents (n=2,505).
Text version of "Figure 3: Frequency of exposure to news stories covering Canadian, U.S., and world politics – detailed March 2023 results"
This graph shows the detailed frequency of exposure to news stories covering Canadian, U.S., and world politics. The distribution is as follows:
Canadian politics:
Very often: 44%;
Somewhat often: 38%;
Somewhat rarely: 11%;
Very rarely: 6%;
I don't know: 2%.
U.S. politics:
Very often: 33%;
Somewhat often: 38%;
Somewhat rarely: 16%;
Very rarely: 11%;
I don't know: 2%.
World politics:
Very often: 26%;
Somewhat often: 43%;
Somewhat rarely: 19%;
Very rarely: 11%;
I don't know: 2%.
The likelihood of seeing stories covering Canadian politics varied across the following demographic groups:
Men (84%) were more likely than women (78%).
Respondents over 55 years old (90%) were more likely, while those aged 18–34 (71%) and 35–54 (79%).
Residents of Alberta (85%) were more likely than those in other parts of Canada.
Respondents living in urban or suburban areas (83%) were more likely than those who live in rural or small-town areas (78%).
Respondents with a university degree (86%) were more likely than those with a high school or lower education level (73%).
Non-Indigenous respondents (82%) were more likely than Indigenous respondents (75%).
Respondents who are interested in politics (93%) were more likely than those who are not (56%).
Habitual voters (87%) were more likely than infrequent voters (64%).
Respondents who know provincial and federal areas of jurisdiction (85%) were more likely than those who do not (65%).
Respondents who do not hold any conspiracy beliefs (88%) were more likely, while those with mixed conspiracy beliefs (77%) were less likely.
Respondents who are generally trusting of people (90%) were more likely than those who tend to be distrustful (77%).
Respondents who feel somewhat polarized (86%) in how they relate to other Canadians politically were more likely, while those who do not feel polarized were less likely (76%).
Interest in politics
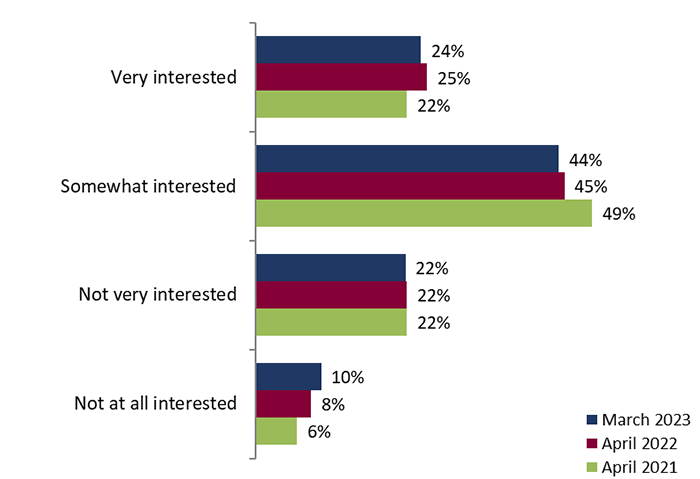
A majority of electors were interested in politics (68%), including nearly one in four (24%) who are very interested and over four in 10 (44%) who are somewhat interested. On the other hand, around three in 10 (31%) were not interested in politics, including one in five (22%) who were not very interested, and around one in 10 (10%) who were not at all interested. These results remained unchanged since April 2022.
Figure 4: Interest in politics
Q: In general, how interested are you in politics? Base: All respondents (n=2,505).
Text version of "Figure 4: Interest in politics"
This graph shows the level of interest of respondents in politics. The breakdown is as follows:
2023:
Very interested: 24%;
Somewhat interested: 44%;
Not very interested: 22%;
Not at all interested: 10%.
2022:
Very interested: 25%;
Somewhat interested: 45%;
Not very interested: 22%;
Not at all interested: 8%.
2021:
Very interested: 22%;
Somewhat interested: 49%;
Not very interested: 22%;
Not at all interested: 6%.
Interest in politics varied across the following groups:
Men (77%) were more likely to be interested in politics than women (60%).
Electors 55 and older (75%) were more likely to be interested in politics, while electors aged 35–54 (65%) and 18–34 (61%) were less likely.
Respondents with at least some university education (76%) were more likely to be interested in politics, whereas those with a high school or less education (56%) and those with a college degree (63%) were less likely.
Respondents living in Alberta (74%) were more likely to be interested, whereas those living in Quebec were less likely (63%).
Respondents living in urban or suburban areas (70%) were more likely to be interested in politics than those who lived in rural areas or small towns (63%).
Respondents with a university-level education (76%) were more likely to be interested in politics, while those with a college (63%) or high school or less (56%) education were less likely.
Habitual voters (74%) were more likely to be interested than infrequent voters (49%).
Those who voted in the 2021 federal general election (74%) were more likely to be interested in politics than those who were eligible but did not vote (58%).2
Respondents who had knowledge of federal and provincial powers (72%) were more likely to be interested than those who did not (54%).
Electors with no conspiracy beliefs (78%) were more likely to be interested in politics, while those with mixed conspiracy beliefs (61%) were less likely.
Respondents who generally trust people (79%) were more likely to be interested in politics than those who do not (62%).
Respondents who often see news about Canadian politics were more likely to be interested in politics (78%), while those who often see news about U.S./world politics but rarely about Canadian politics (52%) and those who rarely see news about politics from any origin (15%) were less likely.
Respondents who feel somewhat (75%) or strongly (79%) polarized in how they relate to other Canadians politically were more likely to be interested in politics, while those who do not feel polarized (59%) were less likely.
Knowledge of provincial powers
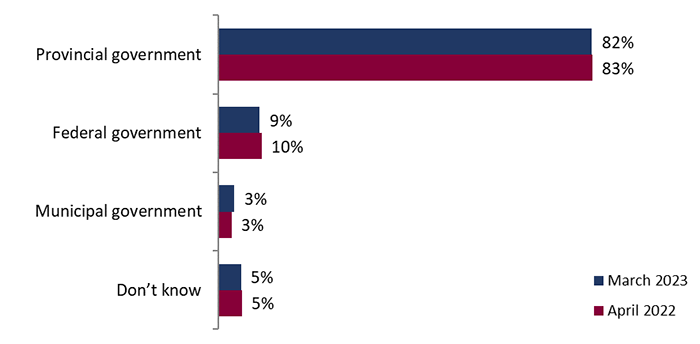
A vast majority of electors knew in March 2023 that the provincial level of government is primarily responsible for education (82%), while one in 10 attributed the responsibility to the federal government (9%). In lesser proportions, some respondents thought it was the municipal government's responsibility (3%), and some others (5%) did not know the answer. These results remain stable since April 2022.
Figure 5: Knowledge of provincial powers
Q: To the best of your knowledge, which level of government has primary responsibility for education? Base: All respondents (n=2,505).
Note: This question was added in April 2022.
Text version of "Figure 5: Knowledge of provincial powers"
This graph shows the proportion of Canadians who attribute the main responsibility for education to the different levels of government. The breakdown is as follows:
March 2023:
Provincial government: 82%;
Federal government: 9%;
Municipal government: 3%;
Don't know: 5%.
April 2022:
Provincial government: 83%;
Federal government: 10%;
Municipal government: 3%;
Don't know: 5%.
The following subgroups were more or less likely to attribute the responsibility for education to the provincial government:
Electors 55 years old and over (88%) were more likely, while those aged 18 to 34 (76%) were less likely.
Respondents from Quebec (89%) and Alberta (86%) were more likely than those from other provinces.
Respondents with some university-level education (88%) were more likely, whereas those with a high school or lower level education were less likely (69%).
Non-Indigenous respondents (83%) were more likely than Indigenous respondents (73%).
Respondents who are interested in politics (87%) were more likely than those who are not (74%).
Habitual voters (87%) were more likely than infrequent voters (67%).
2021 voters (87%) were more likely than their non-voter counterparts (75%).
Respondents with no conspiracy beliefs (91%) were more likely, whereas those who have mixed (79%) or strong conspiracy beliefs (74%) were less likely.
Respondents who often see news about Canadian politics (86%) were more likely, while those who rarely see news about politics from any origin were less likely (69%).
Respondents who feel strongly polarized politically (87%) were more likely than those who do not (80%).
Knowledge of federal powers
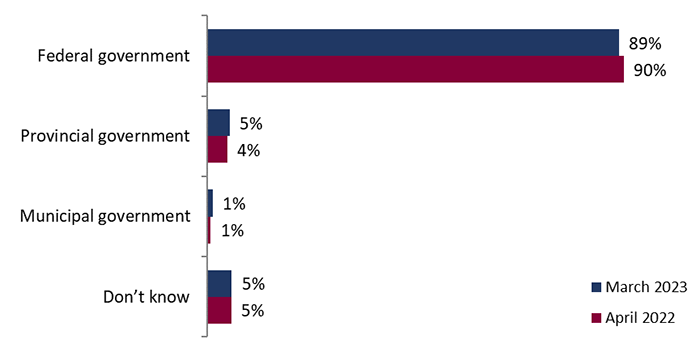
In March 2023, a vast majority of electors had knowledge of federal powers: nine in 10 knew the federal government is primarily responsible for defence (89%). Small proportions thought it was the provincial government (5%), the municipal government (1%), or did not know the answer (5%). These results are stable since April 2022.
Figure 6: Knowledge of federal powers
Q: To the best of your knowledge, which level of government has primary responsibility for defence? Base: All respondents (n=2,505).
Note: As this question was added in April 2022, no comparison can be made with April 2021.
Text version of "Figure 6: Knowledge of federal powers"
This graph shows the proportion of Canadians who attribute the main responsibility for defence to the different levels of government. The breakdown is as follows:
March 2023:
Federal government: 89%;
Provincial government: 5%;
Municipal government: 1%;
Don't know: 5%.
April 2022:
Federal government: 90%;
Provincial government: 4%;
Municipal government: 1%;
Don't know: 5%.
The following subgroups were more or less likely to attribute the responsibility for defence to the federal government:
Electors 55 years old and over (97%) were more likely, while those aged 18 to 34 (77%) were less likely to do so.
Respondents with at least some university-level education (93%) were more likely, while those with a high school or lower-level education were less likely (78%).
Respondents who are interested in politics (93%) were more likely than those who are not interested (80%).
Habitual voters (94%) were more likely than infrequent voters (71%).
2021 voters (94%) were more likely than 2021 non-voters (76%).
Respondents with no conspiracy beliefs (96%) were more likely, while those who have mixed (85%) or strong conspiracy beliefs (83%) were less likely.
Respondents who tend to trust people (94%) were more likely than those who do not (86%).
Respondents who often see news about Canadian politics (93%) were more likely, while those who only often see news about U.S./world politics (73%) and those who rarely see news about politics from any origin (73%) were less likely.
Confidence in institutions in Canada
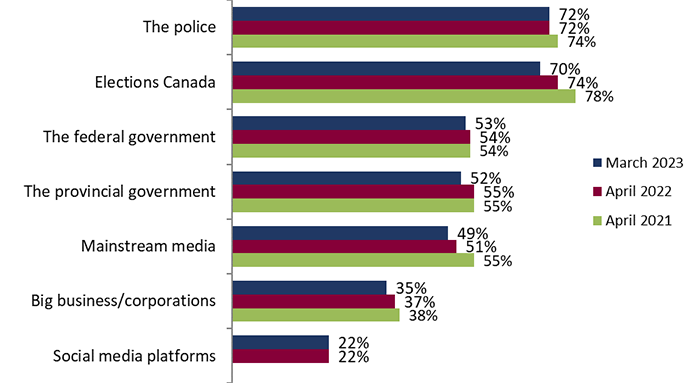
Respondents were asked to rate their confidence in seven institutions in Canada, presented at random. The largest proportion (72%) of respondents said they have a great deal or fair amount of confidence in the police, followed closely by confidence in Elections Canada (70%), which dropped four points since April 2022. Around half expressed confidence in the federal (53%) and provincial governments (52%) as well as the mainstream media (49%). Around a third (35%) had confidence in big businesses and corporations, and only just over one in five (22%) had confidence in social media platforms.
Figure 7: Confidence in Canadian institutions – tracking comparison
Q: How much confidence, if any, do you have in the following institutions in Canada? Base: All respondents (n=2,505).
Note 1: For comparison purposes, a net confidence (a great deal of confidence + a fair amount of confidence) has been calculated.
Note 2: As the "Social media platforms" statement was added in April 2022, no comparison can be made to April 2021.
Text version of "Figure 7: Confidence in Canadian institutions – tracking comparison"
This graph shows respondents' confidence in Canadian institutions. The breakdown is as follows:
2023:
The police: 72%;
Elections Canada: 70%;
The federal government: 53%;
The provincial government: 52%;
Mainstream media: 49%;
Big business or corporations: 35%;
Social media platforms: 22%.
2022:
The police: 72%;
Elections Canada: 74%;
The federal government: 54%;
The provincial government: 55%;
Mainstream media: 51%;
Big business or corporations: 37%;
Social media platforms: 22%.
2021:
The police: 74%;
Elections Canada: 78%;
The federal government: 54%;
The provincial government: 55%;
Mainstream media: 55%;
Big business or corporations: 38%;
Social media platforms: no data.
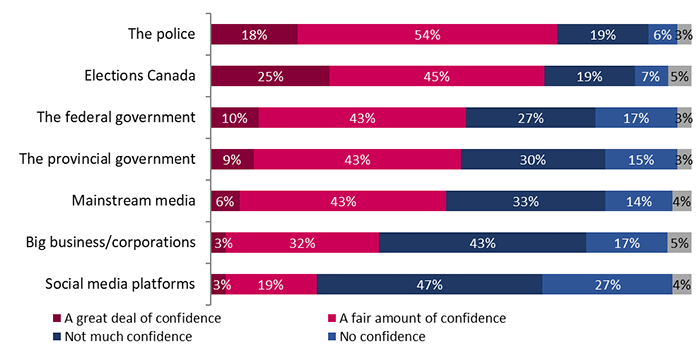
In the detailed results, Elections Canada had the highest proportion (25%) of electors who stated that they have a great deal of confidence in them, compared to the police (18%), the federal and provincial governments (10% and 9% respectively) and the mainstream media (6%).
Figure 8: Confidence in Canadian institutions – detailed March 2023 results
Q: How much confidence, if any, do you have in the following institutions in Canada? Base: All respondents (n=2,505).
Text version of "Figure 8: Confidence in Canadian institutions – detailed March 2023 results"
This graph shows the level of confidence respondents have in different Canadian institutions. The distribution is as follows:
The police:
A great deal of confidence: 18%;
A fair amount of confidence: 54%;
Not much confidence: 19%;
No confidence: 6%;
Don't know: 3%.
Elections Canada:
A great deal of confidence: 25%;
A fair amount of confidence: 45%;
Not much confidence: 19%;
No confidence: 7%;
Don't know: 5%.
The federal government:
A great deal of confidence: 10%;
A fair amount of confidence: 43%;
Not much confidence: 27%;
No confidence: 17%;
Don't know: 3%.
The provincial government:
A great deal of confidence: 9%;
A fair amount of confidence: 43%;
Not much confidence: 30%;
No confidence: 15%;
Don't know: 3%.
Mainstream media:
A great deal of confidence: 6%;
A fair amount of confidence: 43%;
Not much confidence: 33%;
No confidence: 14%;
Don't know: 4%.
Big business or corporations:
A great deal of confidence: 3%;
A fair amount of confidence: 32%;
Not much confidence: 43%;
No confidence: 17%;
Don't know: 5%.
Social media platforms:
A great deal of confidence: 3%;
A fair amount of confidence: 19%;
Not much confidence: 47%;
No confidence: 27%;
Don't know: 4%.
The following subgroups were more or less likely to have a great deal or fair amount of confidence in EC:3
Electors 55 and older (78%) were more likely to have confidence in EC, whereas electors aged 35–54 (64%) and 18–34 (63%) were less likely.
Electors in British Columbia (74%) were more likely to have confidence in EC, while electors in Manitoba/Saskatchewan (63%) were less likely.
Respondents from urban or suburban areas (73%) were more likely to have confidence in EC than those who live in rural or small-town areas (64%).
Respondents with at least some university education (77%) were more likely to have confidence in EC, while those with college (66%) or high school or less education were less likely (56%).
Indigenous respondents (64%) were less likely to have confidence in EC than non-Indigenous respondents (71%).
Respondents who are interested in politics (77%) were more likely to have confidence in EC than those who are not interested (55%).
Habitual voters (75%) were more likely to have confidence in EC than infrequent voters (52%).
2021 voters (75%) were more likely to have confidence in EC than non-voters (59%).
Respondents who have knowledge of federal and provincial powers (75%) were more likely to have confidence in EC than those who do not (53%).
Electors who do not hold conspiracy beliefs (89%) were more likely to have confidence in EC, whereas those with mixed conspiracy beliefs (63%) or strong conspiracy beliefs (48%) were less likely.
Respondents who tend to trust people (84%) were more likely to have confidence in EC than those who do not (62%).
People who often see news about Canadian politics (74%) were more likely to have confidence in EC, while those who rarely see news about politics from any origin were less likely (53%).
Those who feel somewhat polarized (75%) were more likely to have confidence in EC, while those who do not feel polarized were less likely (64%).
Opinion on the fairness of federal elections
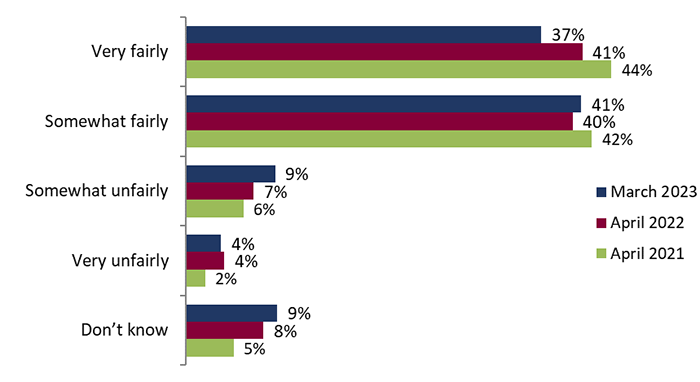
Overall, a majority (78%) of electors in March 2023 thought that Elections Canada runs federal elections fairly, with almost half of these (37%) thinking EC runs elections very fairly, and another half (41%) saying somewhat fairly. Inversely, 13% believed Elections Canada runs the elections unfairly (9% somewhat unfairly, 4% very unfairly).
However, a lower proportion of electors thought Elections Canada runs elections fairly in March 2023 compared to April 2022 (78% versus 81%), continuing the downward trend observed since April 2021 (87%).
Figure 9: Fairness of Elections Canada in running federal elections results
Q: Thinking about federal elections in general, how fairly would you say Elections Canada runs the elections? Base: All respondents (n=2,505).
Text version of "Figure 9: Fairness of Elections Canada in running federal elections"
This graph shows respondents' opinions of Elections Canada's ability to run a fair election. The distribution is as follows:
2023:
Very fairly: 37%;
Somewhat fairly: 41%;
Somewhat unfairly: 9%;
Very unfairly: 4%;
Don't know: 9%.
2022:
Very fairly: 41%;
Somewhat fairly: 40%;
Somewhat unfairly: 7%;
Very unfairly: 4%;
Don't know: 8%.
2021:
Very fairly: 44%;
Somewhat fairly: 42%;
Somewhat unfairly: 6%;
Very unfairly: 2%;
Don't know: 5%.
The following subgroups were more or less likely to think that Elections Canada runs federal elections fairly in general:
Men (82%) were more likely to say that EC runs elections fairly than women (74%).
Electors 55 and older (85%) were more likely to say that EC runs elections fairly, whereas electors 35–54 (72%) and 18–34 (73%) were less likely.
Electors from British Columbia (82%) were more likely to say that EC runs elections fairly, whereas electors from Alberta (73%) were less likely.
Respondents living in urban or suburban areas (80%) were more likely to say that EC runs elections fairly than those living in rural or small-town areas (73%).
Respondents with at least some university education (84%) were more likely to say that EC runs elections fairly, while those with some college or trade education (73%) or a high school or less education (68%) were less likely.
Respondents who are interested in politics (84%) were more likely to say that EC runs elections fairly than those who are not interested (64%).
Habitual voters (82%) were more likely to say that EC runs elections fairly than infrequent voters (65%).
2021 voters (82%) were more likely to say that EC runs elections fairly than non-voters (73%)
Respondents who know federal and provincial powers (81%) were more likely to say that EC runs elections fairly than those who do not (65%).
Electors who do not hold conspiracy beliefs (93%) were more likely to say that EC runs elections fairly, while those with mixed conspiracy beliefs (72%) and those with strong conspiracy beliefs (60%) were less likely.
Those who are generally trusting of people (90%) were more likely to say that EC runs elections fairly than those who are not (71%).
Respondents who often see news about Canadian politics (81%) were more likely to think EC runs elections fairly, while those who rarely see news about politics from any origin were less likely (64%).
Respondents who feel strongly polarized (84%) and somewhat polarized (81%) politically were more likely to think EC runs elections fairly, while those who do not feel polarized were less likely (73%).
Reasons for thinking Elections Canada runs elections unfairly
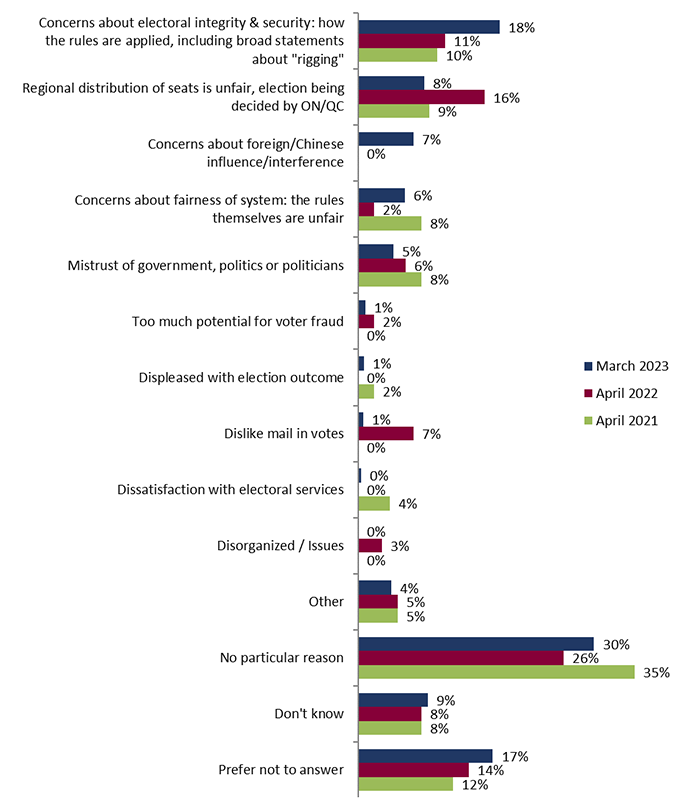
Among the 13% of respondents in March 2023 who thought that Elections Canada runs elections unfairly, around half (44%) provided a reason for this opinion. The other half (56%) did not have any particular reason (30%), did not know (9%), or preferred not to answer (17%).
The most common specific reasons for thinking Elections Canada runs elections unfairly were concerns about electoral integrity and security or thinking elections are "rigged" (18%), that the regional distribution of seats is unfair or allows elections to be decided by Ontario and Quebec (8%), and concerns about foreign/Chinese influence or interference (7%). Other reasons included concerns about fairness of the system (6%) and a general mistrust of government and politicians (5%). Other reasons were mentioned to a lesser extent.
The following reasons for thinking Elections Canada runs elections unfairly were mentioned by a significantly higher proportion of respondents in March 2023 compared to April 2022:
concerns about electoral integrity and security (18% in March 2023 compared to 11% in April 2022)
concerns about foreign/Chinese influence or interference (7% versus 0%)
concerns about fairness of system (6% compared to 2%)
Figure 10: Reasons for thinking that elections are not conducted fairly by Elections Canada
Q: Is there a specific reason you think Elections Canada runs elections unfairly? SPONTANEOUS MENTIONS*
Base: Respondents who said Elections Canada runs the election somewhat unfairly or very unfairly (n=324).
*Because respondents were able to give multiple answers, total mentions may exceed 100%.
Text version of "Figure 10: Reasons for thinking that elections are not conducted fairly by Elections Canada"
This graph shows the reasons some respondents have for believing that Elections Canada runs unfair elections. The distribution is as follows:
2023:
Concerns about electoral integrity and security: how the rules are applied, including broad statements about rigging: 18%;
Regional distribution of seats is unfair, election being decided by Ontario and Quebec: 8%;
Concerns about foreign or Chinese influence or interference: 7%;
Concerns about fairness of system: the rules themselves are unfair: 6%;
Mistrust of government, politics or politicians: 5%;
Too much potential for voter fraud: 1%;
Displeased with election outcome: 1%;
Dislike mail-in votes: 1%;
Dissatisfaction with electoral services: 0%;
Disorganized or issues: 0%;
Other: 4%;
No particular reason: 30%;
Don't know: 9%;
Prefer not to answer: 17%.
2022:
Concerns about electoral integrity & security: how the rules are applied, including broad statements about rigging: 11%;
Regional distribution of seats is unfair, election being decided by Ontario and Quebec: 16%;
Concerns about foreign or Chinese influence or interference: 0%;
Concerns about fairness of system: the rules themselves are unfair: 2%;
Mistrust of government, politics or politicians: 6%;
Too much potential for voter fraud: 2%;
Displeased with election outcome: 0%;
Dislike mail-in votes: 7%;
Dissatisfaction with electoral services: 0%;
Other: 5%;
No particular reason: 26%;
Don't know: 8%;
Prefer not to answer: 14%.
2021:
Concerns about electoral integrity & security: how the rules are applied, including broad statements about rigging: 10%;
Regional distribution of seats is unfair, election being decided by Ontario and Quebec: 9%;
Concerns about foreign or Chinese influence or interference: 0%;
Concerns about fairness of system: the rules themselves are unfair: 8%;
Mistrust of government, politics or politicians: 8%;
Too much potential for voter fraud: 0%;
Displeased with election outcome: 2%;
Dislike mail-in votes: 0%;
Dissatisfaction with electoral services: 4%;
Other: 5%;
No particular reason: 35%;
Don't know: 8%;
Prefer not to answer: 12%.
Notable subgroup differences regarding respondents' main reasons to think that Elections Canada runs elections unfairly include the following:
35 to 54-year-old respondents were significantly more likely to mention concerns about foreign/Chinese influence or interference (11% compared to 1% among 18 to 34-year-olds), while 18 to 34-year-olds were more likely to have no particular reason (39%).
Alberta respondents were significantly more likely to mention an unfair regional distribution of seats (28%) while respondents from Ontario were more likely to mention concerns about electoral integrity and security (26%).
Respondents who are interested in politics were more likely to mention concerns about electoral integrity and security (23% versus 11% among those who are not interested in politics), concerns about fairness of the system (9% versus 2%), and concerns about foreign/Chinese influence or interference (9% versus 4%).
Habitual voters were more likely than infrequent voters to mention an unfair regional distribution of seats (11% versus 2%) and concerns about foreign/Chinese interference or influence (9% versus 2%).
Respondents with strong conspiracy beliefs were more likely to mention concerns about electoral integrity and security (32% versus 12% and 4% among those with mixed or no conspiracy beliefs, respectively).
Respondents who have knowledge of federal and provincial powers (9%) were more likely to be concerned about foreign/Chinese influence or interference than those who do not (2%).
People who often see news about Canadian politics were significantly more likely to mention concerns about electoral integrity and security (22%) and concerns about fairness of the system (8%), while people who rarely saw news about politics from any origin were more likely to have mentioned no particular reason (59%).
Trust in election changes
A split sample experiment was conducted to explore whether electors have general trust in the government to propose changes to how federal elections are run, and if they specifically trust Elections Canada to propose changes.
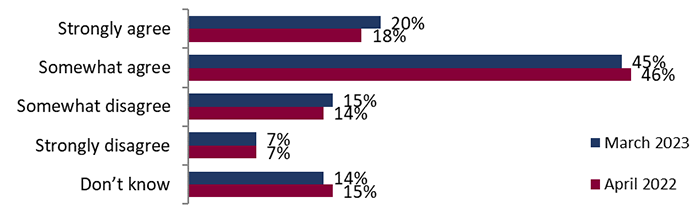
In one half of the split sample, nearly two-thirds (65%) of respondents agreed that if the government proposes changes to how federal elections are run, they are probably trying to make voting easier or fairer for all Canadians: 20% strongly agreed, and 45% somewhat agreed. Conversely, one-fifth (21%) of respondents disagreed: 15% somewhat disagreed and 7% strongly disagreed; 14% said they did not know. Overall, results for both versions of the statement remain stable since April 2022.
Figure 11: Trust in election changes – government
Q: How much do you agree or disagree with the following statement?
If the government proposes changes to how federal elections are run, they are probably trying to make voting easier or fairer for all Canadians.
Base: Half of the respondents (n=1,253).
Note: Question added in April 2022.
Text version of "Figure 11: Trust in election changes – government"
This graph shows respondents' trust in the government to propose election changes. The breakdown is as follows:
2023:
Strongly agree: 20%;
Somewhat agree: 45%;
Somewhat disagree: 15%;
Strongly disagree: 7%;
Don't know: 14%.
2022:
Strongly agree: 18%;
Somewhat agree: 46%;
Somewhat disagree: 14%;
Strongly disagree: 7%;
Don't know: 15%.
The following subgroups were more or less likely to agree that the government proposes changes to how federal elections are run in order to make voting easier or fairer for all Canadians:
18 to 34-year-old electors (70%) were more likely to agree compared to all other ages.
Electors from Quebec (71%) were more likely to agree compared to those from all other parts of Canada.
Respondents who do not have a disability were more likely to agree than those who do (66% versus 55%).
Respondents who hold no conspiracy beliefs (73%) were more likely to agree, whereas those who hold mixed conspiracy beliefs (62%) or strong conspiracy beliefs (54%) were less likely.
Respondents who are generally trusting of people (72%) were more likely to agree than those who are not (62%).
Respondents who feel strongly polarized in how they relate to other Canadians politically were more likely to agree (73%), while those who do not feel polarized were less likely (61%).
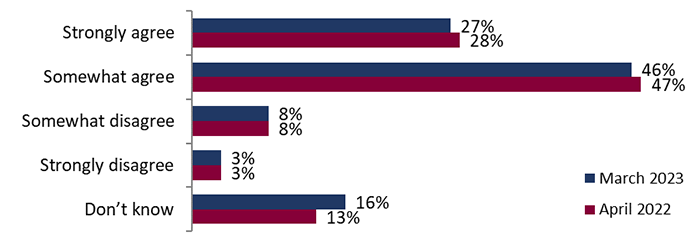
In the other half of the split sample, a higher proportion (73%) of respondents agreed that if Elections Canada proposes changes to how federal elections are run, they are probably trying to make voting easier or fairer for all Canadians: 27% strongly agreed, and 46% somewhat agreed. Conversely, 8% somewhat disagreed and 3% strongly disagreed, while 16% said they did not know, up significantly from 13% in April 2022.
Figure 12: Trust in election changes – Elections Canada
Q: How much do you agree or disagree with the following statement?
If Elections Canada proposes changes to how federal elections are run, they are probably trying to make voting easier or fairer for all Canadians.
Base: Half of the respondents (n=1,252).
Note: Question added in April 2022.
Text version of "Figure 12: Trust in election changes – Elections Canada"
This graph shows respondents' trust in Elections Canada to propose election changes. The breakdown is as follows:
March 2023:
Strongly agree: 27%;
Somewhat agree: 46%;
Somewhat disagree: 8%;
Strongly disagree: 3%;
Don't know: 16%.
April 2022:
Strongly agree: 28%;
Somewhat agree: 47%;
Somewhat disagree: 8%;
Strongly disagree: 3%;
Don't know: 13%.
The following subgroups were more or less likely to agree that Elections Canada proposes changes to how federal elections are run in order to make voting easier or fairer for all Canadians:
Electors from Quebec were more likely to agree (79%), while those from Alberta were less likely (66%).
Respondents who live in urban or suburban areas (75%) were more likely to agree than those who live in rural or small-town areas (69%).
Respondents with a university degree or higher were more likely to agree (77%) than all those with a lower level of education.
Respondents who are interested in politics (79%) were more likely to agree than those who are not (62%).
Habitual voters were more likely to agree (75%) than infrequent voters (67%).
Respondents who know provincial and federal powers were more likely to agree (75%) than those who did not (66%).
Respondents who hold no conspiracy beliefs (88%) were more likely to agree, whereas those who hold mixed conspiracy beliefs (66%) or strong conspiracy beliefs (63%) were less likely.
Respondents who are generally trusting of people (82%) were more likely to agree than those who are not (70%).
Respondents who often see news about Canadian politics were more likely to agree (77%), while those who rarely see news about politics from any origin were less likely (62%).
Respondents who feel somewhat polarized politically were more likely to agree (80%), while those who do not feel polarized were less likely (67%).
Electoral interference
Respondents were asked if they thought different types of electoral interference could have any impact on the outcome of the next federal election in Canada.
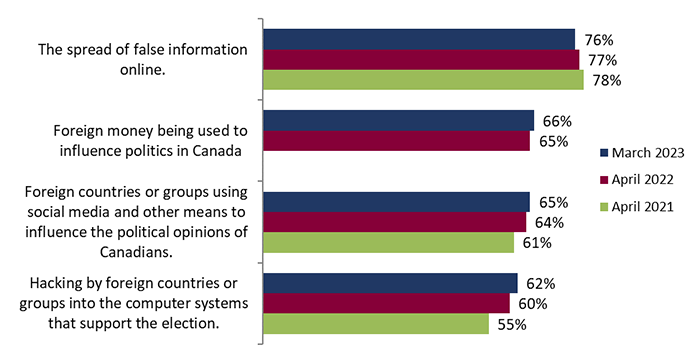
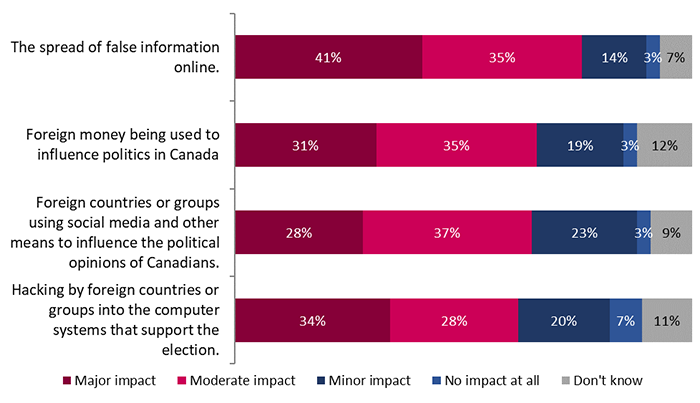
Similar to April 2022, the largest proportion (76%) of electors in March 2023 thought that the spread of false information online could have a moderate or more impact on the outcome of the next federal elections, including four in 10 (41%) who thought it could have a major impact. The second-largest proportion (66%) thought that foreign money being used to influence Canadian politics could have an impact (31% a major impact), closely followed by 65% who thought foreign countries or groups using social media and other means to influence the political opinions of Canadians could have an impact (28% a major impact). Finally, six in 10 (62%) electors thought hacking by foreign countries or groups into the computer systems that support the election could have an impact on the election (34% a major impact).
The proportions who thought different types of electoral interference could have a moderate or more impact on the outcome of the next federal election remain unchanged from April 2022. However, significantly higher proportions of respondents thought that there could be a major impact from foreign money being used to influence politics in Canada (31% versus 27% in April 2022) and from hacking by foreign countries or groups into the computer systems that support the election (34% versus 29%).
Figure 13: Perceived impact of interference on the outcome of the next federal election – Tracking
Q: Based on what you have seen or heard recently, what impact, if any, do you think the following could have on the outcome of the next federal election in Canada? Base: All respondents (n=2,505).
Note 1: For comparison purposes, a net impact (major + moderate impact) has been calculated.
Note 2: The statement "Foreign money being used to influence politics in Canada" was added in wave 2 (April 2022).
Text version of "Figure 13: Perceived impact of interference on the outcome of the next federal election – Tracking"
This graph shows respondents' perceptions of the impacts of interference on the outcome of the next federal election. This is broken down by type of interference. The breakdown is as follows:
March 2023:
The spread of false information online: 76%;
Foreign money being used to influence politics in Canada: 66%;
Foreign countries or groups using social media and other means to influence the political opinions of Canadians: 65%;
Hacking by foreign countries or groups into the computer systems that support the election: 62%.
April 2022:
The spread of false information online: 77%;
Foreign money being used to influence politics in Canada: 65%;
Foreign countries or groups using social media and other means to influence the political opinions of Canadians: 64%;
Hacking by foreign countries or groups into the computer systems that support the election: 60%.
April 2021:
The spread of false information online: 78%;
Foreign money being used to influence politics in Canada: no data;
Foreign countries or groups using social media and other means to influence the political opinions of Canadians: 61%;
Hacking by foreign countries or groups into the computer systems that support the election: 55%.
Figure 14: Perceived impact of interference on the outcome of the next federal election – March 2023 results
Q: Based on what you have seen or heard recently, what impact, if any, do you think the following could have on the outcome of the next federal election in Canada? Base: All respondents (n=2,505).
Text version of "Figure 14: Perceived impact of interference on the outcome of the next federal election – March 2023 results"
This graph shows respondents' perceptions of different factors that could impact the outcome of the upcoming election. The distribution is as follows:
2023:
The spread of false information online:
Major impact: 41%;
Moderate impact: 35%;
Minor impact: 14%;
No impact at all: 3%;
Don't know: 7%.
Foreign money being used to influence politics in Canada:
Major impact: 31%;
Moderate impact: 35%;
Minor impact: 19%;
No impact at all: 3%;
Don't know: 12%.
Foreign countries or groups using social media and other means to influence the political opinions of Canadians:
Major impact: 28%;
Moderate impact: 37%;
Minor impact: 23%;
No impact at all: 3%;
Don't know: 9%.
Hacking by foreign countries or groups into the computer systems that support the election:
Major impact: 34%;
Moderate impact: 28%;
Minor impact: 20%;
No impact at all: 7%;
Don't know: 11%.
The following subgroups were more or less likely to think that "the spread of false information online" could have a moderate or major impact on the outcome of the next federal election:
Electors with a university degree or higher (78%) were more likely, while those with a high school degree or less were less likely (69%).
Respondents who are interested in politics (80%) were more likely than those who are not interested in politics (67%).
Habitual voters (77%) were more likely than infrequent voters (71%).
Electors who know federal and provincial powers (79%) were more likely than those who do not (64%).
Electors with no conspiracy beliefs (81%) were more likely, while those with mixed conspiracy beliefs (71%) were less likely.
People who often see news about Canadian politics were more likely (79%), while those who rarely see news about politics from any origin were less likely (62%).
Respondents who feel somewhat (81%) or strongly (86%) polarized politically were more likely, while those who do not feel polarized were less likely (69%).
The following subgroups were more or less likely to think that "foreign money being used to influence politics in Canada" could have a moderate or major impact on the outcome of the next federal election:
Electors over 55 years old (70%) were more likely to think that foreign money could have an impact, whereas electors aged 18–34 (60%) were less likely to think so.
Respondents who are interested in politics (72%) were more likely to think that foreign money could have an impact than those who are not interested (53%).
Habitual voters (68%) were more likely to think that foreign money could have an impact than infrequent voters (59%).
Respondents who know provincial and federal powers (68%) were more likely to think that foreign money could have an impact than those who do not (59%).
Respondents who hold strong conspiracy beliefs (81%) were more likely to think that foreign money could have an impact, whereas those with or mixed conspiracy beliefs (62%) were less likely to think so.
People who often see news about Canadian politics (70%) were more likely to think that foreign money could have an impact, while those who rarely see news about politics from any origin (44%) were less likely.
Respondents who feel strongly (77%) or somewhat (70%) polarized politically were more likely, while those who do not feel polarized (60%) were less likely.
The following subgroups were more or less likely to think that "foreign countries or groups using social media and other means to influence the political opinions of Canadians" could have a moderate or major impact on the outcome of the next federal election:
Respondents interested in politics (71%) were more likely to think that foreign influence efforts could have an impact than those who are not interested (51%).
Habitual voters (67%) were more likely to think that foreign influence efforts could have an impact than infrequent voters (56%).
Respondents who have knowledge of provincial and federal powers (68%) were more likely to think that foreign influence efforts could have an impact than those who do not (54%).
Electors with strong conspiracy beliefs (77%) were more likely to think that foreign influence efforts could have an impact, whereas those with mixed conspiracy beliefs (62%) were less likely to think so.
People who often see news about Canadian politics were more likely to think that foreign influence efforts could have an impact (68%), while those who rarely see news about politics from any origin were less likely to think so (46%).
Respondents who feel somewhat (69%) or strongly (76%) polarized politically were more likely to think that influence efforts could have an impact, while those who do not feel polarized were less likely (57%).
The following subgroups were more or less likely to think that "hacking by foreign countries or groups into the computer systems that support the election" could have a moderate or major impact on the outcome of the next federal election:
Electors over 55 years old (66%) were more likely to think that hacking into election systems could have an impact on the outcome of the next election, while those who are 18–34 (57%) were less likely to think so.
Women (64%) were more likely to think that that hacking could have an impact than men (60%).
Quebec electors (71%) were more likely than those in other regions to believe that hacking could have an impact.
Respondents who are interested in politics (65%) were more likely to think that hacking could have an impact than those who are not (55%).
Respondents who have knowledge of federal and provincial powers (64%) were more likely to think hacking could have an impact than those who do not (57%).
Electors with strong conspiracy beliefs (80%) were more likely to think that hacking could have an impact, while those who do not hold conspiracy beliefs (55%) were less likely to think so.
People who often see news about Canadian politics were more likely to think that hacking could have an impact (64%), while those who rarely see news about politics from any origin were less likely to think so (49%).
Respondents who feel somewhat (66%) or strongly (73%) polarized politically were more likely to think hacking could have an impact, while those who do not feel polarized were less likely (56%).
Opinions on the integrity of the voting system in Canada
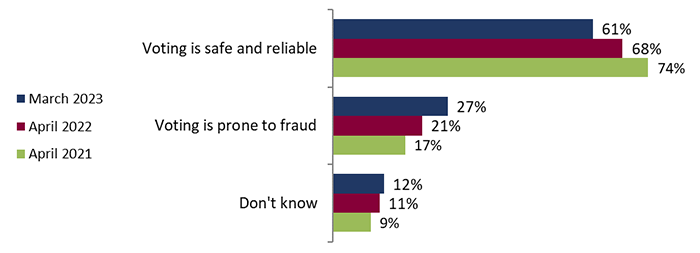
In March 2023, around six out of 10 respondents (61%) from a split sample of electors thought that the voting system in Canada is safe and reliable, over one in four thought it is prone to fraud (27%), and one in 10 did not know (12%).
A significantly lower proportion of respondents agreed with the statement "voting is safe and reliable" in March 2023 (61%) compared to April 2022 (68% ) and a higher proportion agreed that voting is prone to fraud (27% versus 21%), continuing the trends observed since April 2021.
Figure 15: Opinion regarding the voting system in Canada
Q: Which statement is closest to your opinion about the voting system in Canada? Base: Half of the respondents (n=1,253).
Text version of "Figure 15: Opinion regarding the voting system in Canada"
This graph shows respondents' opinions about the reliability of the voting system in Canada. The distribution is as follows:
March 2023:
Voting is safe and reliable: 61%;
Voting is prone to fraud: 27%;
Do not know: 12%.
April 2022:
Voting is safe and reliable: 68%;
Voting is prone to fraud: 21%;
Do not know: 11%.
April 2021:
Voting is safe and reliable: 74%;
Voting is prone to fraud: 17%;
Do not know: 9%.
The following subgroups were more or less likely to believe that the voting system in Canada is safe and reliable:
Men (65%) were more likely to think the voting system is safe and reliable than women (58%).
British Columbia electors were more likely to agree with voting being safe and reliable (70%), while those from Quebec were less likely (52%).
Respondents who live in an urban or suburban area (64%) were more likely to think the voting system is safe and reliable, while those who live in rural areas or small towns were less likely (56%).
Respondents with at least some university education (69%) were more likely to think the voting system is safe and reliable, while respondents with a high school or less education (50%) were less likely.
Immigrant respondents were more likely to consider voting to be safe and reliable (72%) than non-immigrants (60%).
Respondents who are interested in politics (65%) were more likely to think the voting system is safe and reliable than those who are not interested (52%).
Habitual voters (65%) were more likely to think the voting system is safe and reliable than infrequent voters (48%).
Those who voted in the 2021 election (66%) were more likely to think the voting system is safe and reliable than those who did not vote in 2021 (43%).
Electors who do not hold conspiracy beliefs (80%) were more likely to think the voting system is safe and reliable, while those with mixed conspiracy beliefs (55%) and those with strong conspiracy beliefs (38%) were less likely.
Electors who tend to be trusting toward people (73%) were more likely to think the voting system is safe and reliable, while those who are distrustful were less likely (54%).
Respondents who often see news about Canadian politics were more likely to think voting is safe and reliable (64%), while those who rarely see news about politics from any origin were less likely (46%).
Opinions on the integrity of voting by mail in Canada
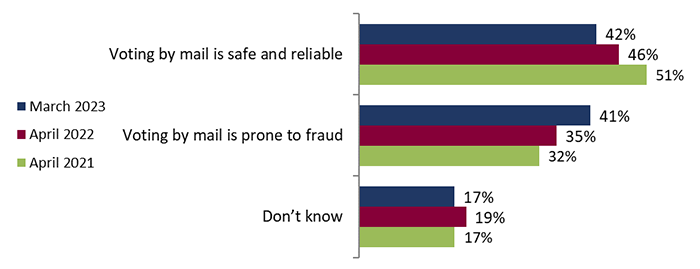
In March 2023, four in 10 (42%) from a split sample of respondents thought voting by mail is safe and reliable, and the same proportion thought it is prone to fraud (41%). Fewer than one in five (17%) did not know.
A significantly lower proportion of respondents agreed with the statement "voting by mail is safe and reliable" in March 2023 (42%) compared to April 2022 (46%), and a significantly higher proportion of respondents agreed with the statement "voting by mail is prone to fraud" (41% versus 35%), continuing the trends observed since April 2021.
Figure 16: Opinion regarding voting by mail
Q: Which statement is closest to your opinion about voting by mail in Canada? Base: Half of the respondents (n=1,252).
Text version of "Figure 16: Opinion regarding voting by mail"
This graph shows respondents' opinions on the reliability of the mail-in ballot system in Canada. The distribution is as follows:
March 2023:
Voting by mail is safe and reliable: 42%;
Voting by mail is prone to fraud: 41%;
Do not know: 17%.
April 2022:
Voting by mail is safe and reliable: 42%;
Voting by mail is prone to fraud: 41%;
Do not know: 17%.
April 2021:
Voting by mail is safe and reliable: 51%;
Voting by mail is prone to fraud: 32%;
Do not know: 17%.
The following subgroups were more or less likely to believe that voting by mail is safe and reliable:
Men (48%) were more likely to believe that voting by mail is safe and reliable than women (35%).
British Columbia respondents were more likely to think voting by mail is safe and reliable (57%), while respondents from Quebec were less likely (35%).
Electors living in urban or suburban areas were more likely to think voting by mail is safe and reliable (45%), while those in rural or small-town areas were less likely (32%).
Respondents with a university education (46%) were more likely to believe that voting by mail is safe and reliable, while respondents with a college or trade degree were less likely (36%).
Respondents who are interested in politics (49%) were more likely to believe that voting by mail is safe and reliable, while those who are not interested were less likely (26%).
Habitual voters were more likely to believe that voting by mail is safe and reliable (43%) than infrequent voters (36%).
Respondents who have knowledge of provincial and federal powers were more likely to believe that voting by mail is safe and reliable (43%) than those who do not (36%).
Electors who do not hold conspiracy beliefs (63%) were more likely to believe that voting by mail is safe and reliable, while those with mixed conspiracy beliefs (32%) and those with strong conspiracy beliefs (22%) were less likely.
Respondents who are generally trusting of people (60%) were more likely to believe that voting by mail is safe and reliable than those who are distrustful (32%).
Respondents who often see news about Canadian politics are more likely to think voting by mail is safe and reliable (44%), while those who rarely see news about politics from any origin (28%) were less likely.
Respondents who feel strongly polarized politically (56%) were more likely to think that voting by mail is safe and reliable, while those who do not feel polarized (35%) were less likely.
Types of voter fraud
Electors were asked how often they think different types of voter fraud happen in Canadian federal elections.
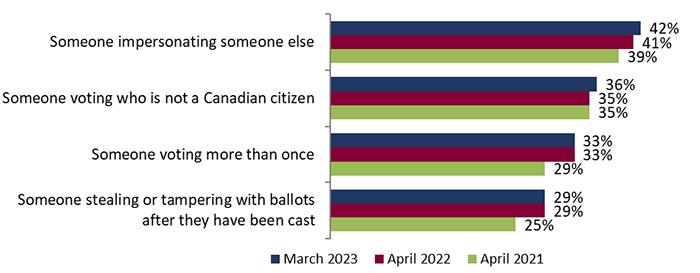
Similar to April 2022, two in five (42%) electors in March 2023 think that someone impersonating someone else is a type of voter fraud that happens in Canadian federal elections, with one in 10 (9%) thinking it happens often, and one in three (32%) thinking it happens sometimes.
Just over one in three (36%) think that someone voting who is not a Canadian citizen happens often (9%) or (27%) sometimes, and a third (33%) also think that someone voting more than once happens often (8%) or sometimes (25%). The smallest proportion (29%) think someone stealing or tampering with ballots after they have been cast happens often (6%) or sometimes (23%).
All proportions remain stable since April 2022.
Figure 17: Perception of the frequency of certain types of fraud – Tracking
Q: Overall, how often do you think the following types of voter fraud happen in Canadian federal elections? Base: All respondents (n=2,505).
Note: For analysis purposes, a total frequent (often + sometimes) has been calculated.
Text version of "Figure 17: Perception of the frequency of certain types of fraud – Tracking"
This graph shows respondents' perceptions of the frequency of particular types of election fraud. The distribution is as follows:
March 2023:
Someone impersonating someone else: 42%;
Someone voting who is not a Canadian citizen: 36%;
Someone voting more than once: 33%;
Someone stealing or tampering with ballots after they have been cast: 29%.
April 2022:
Someone impersonating someone else: 41%;
Someone voting who is not a Canadian citizen: 35%;
Someone voting more than once: 33%;
Someone stealing or tampering with ballots after they have been cast: 29%.
April 2021:
Someone impersonating someone else: 39%;
Someone voting who is not a Canadian citizen: 35%;
Someone voting more than once: 29%;
Someone stealing or tampering with ballots after they have been cast: 25%.
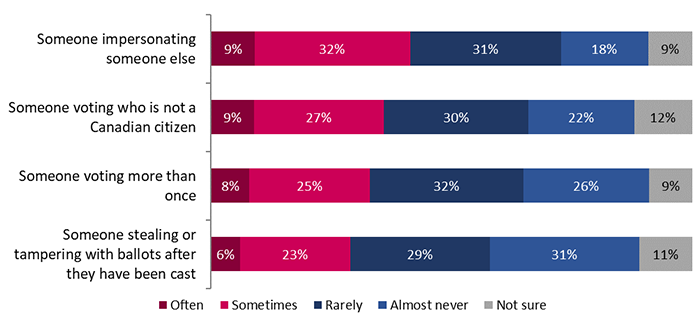
Figure 18: Perception of the frequency of certain types of fraud – detailed March 2023 results
Q: Overall, how often do you think the following types of voter fraud happen in Canadian federal elections? Base: All respondents (n=2,505).
Text version of "Figure 18: Perception of the frequency of certain types of fraud – detailed March 2023 results"
This graph shows respondents' perceptions of the frequency of particular types of election fraud. The distribution is as follows:
Someone impersonating someone else:
Often: 9%;
Sometimes: 32%;
Rarely: 31%;
Almost never: 18%;
Not sure: 9%.
Someone voting who is not a Canadian citizen:
Often: 9%;
Sometimes: 27%;
Rarely: 30%;
Almost never: 22%;
Not sure: 12%.
Someone voting more than once:
Often: 8%;
Sometimes: 25%;
Rarely: 32%;
Almost never: 26%;
Not sure: 9%.
Someone stealing or tampering with ballots after they have been cast:
Often: 6%;
Sometimes: 23%;
Rarely: 29%;
Almost never: 31%;
Not sure: 11%.
The following subgroups were more or less likely to think that "someone impersonating someone else" is a kind of fraud that happens often or sometimes in Canadian federal elections:
Women (45%) were more likely to think impersonation happens than men (38%).
Electors living in Quebec (49%) were more likely to think impersonation happens, while electors living in British Columbia (33%) were less likely.
Respondents living in rural areas or small towns (46%) were more likely to think impersonation happens than those who live in urban or suburban areas (40%).
Respondents with some college or trade school education (46%) were more likely to think impersonation happens, while those with at least some university education (38%) were less likely to think so.
Non-immigrant respondents (42%) were more likely to think impersonation happens often or sometimes than immigrant respondents (35%).
Electors with strong (70%) or mixed (44%) conspiracy beliefs were more likely to think impersonation happens, while those who do not hold conspiracy beliefs (26%) were less likely.
Respondents who tend to be distrustful of people (49%) were more likely to think impersonation happens than those who tend to be trusting (32%).
Respondents who feel somewhat polarized politically (44%) were more likely to think impersonation happens, while those who do not feel polarized (39%) were less likely.
The following subgroups were more or less likely to think that "someone voting who is not a Canadian citizen" is a kind of fraud that happens often or sometimes in Canadian federal elections:
Albertan electors (43%) were more likely to think it happens often or sometimes compared to electors in all other provinces.
Respondents with a high school or less education (43%) and those with a college-level education (39%) were more likely to think non-citizen voting happens, while those with some university education (31%) were less likely.
Indigenous electors (51%) were more likely to think non-citizen voting happens than non-Indigenous electors (35%).
Canadian-born electors (36%) were more likely to think non-citizen voting happens than immigrant electors (30%).
Electors living with a disability (43%) were more likely to think non-citizen voting happens than those who are not living with a disability (35%).
Infrequent voters (40%) were more likely to think non-citizen voting happens than habitual voters (34%).
Electors with strong conspiracy beliefs (66%) were more likely to think non-citizen voting happens while those who do not hold conspiracy beliefs (22%) were less likely.
Respondents who tend to be distrustful of people (41%) were more likely to think non-citizen voting happens than those who tend to be trusting (29%).
The following subgroups were more or less likely to think that "someone voting more than once" is a kind of fraud that happens often or sometimes in Canadian federal elections:
Electors living in Quebec (41%) were more likely to think multiple voting happens, while electors living in British Columbia (26%) were less likely.
Respondents in rural or small towns (38%) were more likely to think multiple voting happens than those in urban or suburban areas (30%).
Respondents with a high school degree or less (38%) and those with some college or trade education (37%) were more likely to think multiple voting happens, while those with at least some university education (28%) were less likely.
Indigenous voters (48%) were more likely to think multiple voting happens than non-Indigenous voters (32%).
Canadian-born electors (33%) were more likely to think multiple voting happens than immigrant electors (26%).
Infrequent voters (41%) were more likely to think multiple voting happens than habitual voters (30%).
2021 non-voters (41%) were more likely to think multiple voting happens than 2021 voters (30%).
Respondents who do not have knowledge of federal and provincial powers (38%) were more likely to think multiple voting happens than those who do (31%).
Electors with strong conspiracy beliefs (64%) were more likely to think multiple voting happens, while those who do not hold conspiracy beliefs (17%) were less likely.
Respondents who tend to be distrustful of people (38%) were more likely to think multiple voting happens than those who tend to be trusting (25%).
The following subgroups were more or less likely to think that "someone stealing or tampering with ballots after they have been cast" is a kind of fraud that happens often or sometimes in Canadian federal elections:
Female electors (33%) were more likely to think ballot tampering happens than male electors (26%).
Electors aged 18–34 (39%) were more likely to think ballot tampering happens than electors 55 and older (21%).
Respondents from Ontario (32%) were more likely to think ballot tampering happens, while those from British Columbia (21%) were less likely.
Respondents living in a rural or small-town area (32%) were more likely to think ballot tampering happens than those living in urban or suburban areas (28%).
Respondents with a high school degree or less education (34%) were more likely to think ballot tampering happens, while those with some university education (26%) were less likely.
Indigenous electors (43%) were more likely to think ballot tampering happens than non-Indigenous electors (29%).
Infrequent voters (40%) were more likely to think ballot tampering happens than habitual voters (26%).
2021 non-voters (41%) were more likely to think ballot tampering happens than 2021 voters (26%).
Respondents who do not have knowledge of provincial and federal powers (38%) were more likely to think ballot tampering happens than those who do (27%).
Electors with strong (62%) or mixed (32%) conspiracy beliefs were more likely to think ballot tampering happens, while those who do not hold conspiracy beliefs (12%) were less likely.
Respondents who tend to be distrustful of people (36%) were more likely to think ballot tampering happens than those who tend to be trusting (21%).
Respondents who feel somewhat polarized politically (33%) were more likely to think ballot tampering happens, while those who do not feel polarized (26%) were less likely.
Political efficacy
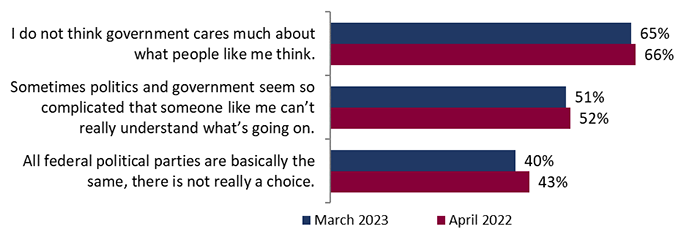
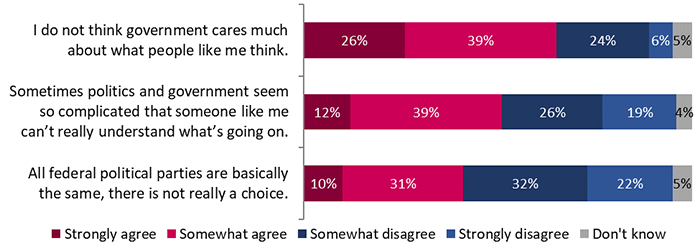
In March 2023, two-thirds of electors (65%) said they do not think the government cares much what people like them think: 26% strongly agreed and 39% somewhat agreed. Around half of Canadian electors (51%) agreed either strongly (12%) or somewhat (39%) that sometimes politics and government seem so complicated that someone like them can't understand it. Finally, four in 10 (40%) agreed that all federal political parties are basically the same and do not really offer a choice, including 10% who strongly agreed and 31% who somewhat agreed.
In March 2023, a significantly lower proportion of Canadian electors agreed with the statement "all federal political parties are basically the same, there is not really a choice" (40% versus 43% in April 2022).
Figure 19: Perceived political efficacy – tracking
Q: Thinking about government and politics in Canada, how strongly do you agree or disagree with the following statements? Base: All respondents (n=2,505).
Note: For analysis purposes, a total agree (strongly + somewhat agree) has been calculated.
Note: Question added in April 2022.
Text version of "Figure 19: Perceived political efficacy – tracking"
This graph shows the evolution of the perceived efficacy of the government and politics in Canada. The breakdown is as follows:
March 2023:
I do not think government cares much about what people like me think: 65%;
Sometimes politics and government seem so complicated that someone like me can't really understand what's going on: 51%;
All federal political parties are basically the same, there is not really a choice: 40%.
April 2022:
I do not think government cares much about what people like me think: 66%;
Sometimes politics and government seem so complicated that someone like me can't really understand what's going on: 52%;
All federal political parties are basically the same, there is not really a choice: 43%.
Figure 20: Perceived political efficacy – detailed March 2023 results
Q: Thinking about government and politics in Canada, how strongly do you agree or disagree with the following statements? Base: All respondents (n=2,505).
Text version of "Figure 20: Perceived political efficacy – detailed March 2023 results"
This graph shows the perceived efficacy of the government and politics in Canada. The breakdown is as follows:
2023:
I do not think government cares much about what people like me think.
Strongly agree: 26%;
Somewhat agree: 39%;
Somewhat disagree: 24%;
Strongly disagree: 6%;
Don't know: 5%.
Sometimes politics and government seem so complicated that someone like me can't really understand what's going on.
Strongly agree: 12%;
Somewhat agree: 39%;
Somewhat disagree: 26%;
Strongly disagree: 19%;
Don't know: 4%.
All federal political parties are basically the same, there is not really a choice.
Strongly agree: 10%;
Somewhat agree: 31%;
Somewhat disagree: 32%;
Strongly disagree: 22%;
Don't know: 5%.
The following subgroups were more or less likely to agree with the statement "I do not think government cares much about what people like me think":
Electors aged 35–54 (68%) were more likely to agree than all other ages.
Respondents living in Alberta (74%) and Manitoba/Saskatchewan (71%) were more likely to agree, while those living in Quebec (58%) were less likely to agree.
Respondents with some college or trade education (71%) were more likely to agree, while those with university education (59%) were less likely.
Respondents living with a disability were more likely to agree (73%) than others (63%).
Respondents who are not interested in politics (69%) were more likely to agree than those who are (63%).
Respondents who hold strong conspiracy beliefs (87%) were more likely to agree, while those who hold no conspiracy beliefs (53%) were less likely.
Respondents who tend to be distrustful of people (71%) were more likely to agree than those who tend to be trusting (58%).
Respondents who feel strongly polarized politically (71%) were more likely to agree compared to all those who feel less polarized.
The following subgroups were more or less likely to agree with the statement "Sometimes politics and government seem so complicated that someone like me can't really understand what's going on":
Female respondents (57%) were more likely to agree than male respondents (45%).
18 to 34-year-old respondents (62%) were more likely to agree, while respondents aged 55 and older (45%) were less likely.
Respondents living in a rural or small-town area were more likely to agree (57%) than those living in urban or suburban areas (49%).
Respondents with a high school education or less (63%) or college education (55%) were more likely to agree, while those with some university-level education (44%) were less likely.
Respondents who are not interested in politics (68%) were more likely to agree than those who are interested (44%).
Infrequent voters (66%) were more likely to agree than habitual voters (46%).
2021 non-voters (65%) were more likely to agree than 2021 voters (47%).
Respondents with no knowledge of federal and provincial powers (65%) were more likely to agree than those who do have knowledge of them (47%).
Respondents with strong (68%) or mixed (56%) conspiracy beliefs were more likely to agree, while those with no conspiracy beliefs (37%) were less likely.
Respondents who tend to be distrustful of people (58%) were more likely to agree than those who tend to be trusting (43%).
Respondents who often see news about U.S./world politics but rarely see news about Canadian politics (63%) as well as those who rarely see news about politics from any origin (67%) were more likely to agree, while those who often see news about Canadian politics (48%) were less likely.
Respondents who feel strongly polarized politically (58%) were more likely to agree than all those who feel less polarized.
The following subgroups were more or less likely to agree with the statement "All federal political parties are basically the same, there is not really a choice":
Respondents aged 35 to 54 (44%) were more likely to agree, while those aged 55 and older (36%) were less likely.
Respondents from the Atlantic region (48%) were more likely to agree, while those from Manitoba/Saskatchewan were less likely (34%).
Respondents living in rural or small-town areas (47%) were more likely to agree than those who live in urban or suburban areas (38%).
Those with a high school or less education (48%) or a college education (45%) were more likely to agree, while those with some university education (34%) were less likely.
Immigrant electors (48%) were more likely to agree than Canadian-born electors (39%).
Respondents who are not interested in politics (51%) were more likely to agree than those who are interested (36%).
Infrequent voters (52%) were more likely to agree than habitual voters (37%).
2021 non-voters (59%) were more likely to agree than 2021 voters (35%).
Respondents who do not know provincial and federal powers (51%) were more likely to agree than those who do (37%).
Respondents with strong (68%) or mixed (43%) conspiracy beliefs were more likely to agree, while those with no conspiracy beliefs (24%) were less likely.
Respondents who tend to be distrustful of people (48%) were more likely to agree than those who are trusting (30%).
Respondents who often see news about U.S./world politics but rarely see news about Canadian politics (51%) as well as those who rarely see news about politics from any origin (51%) were more likely to agree, while those who often see news about Canadian politics (38%) were less likely.
Respondents who feel strongly polarized politically (47%) were more likely to agree than all those who feel less polarized.
Affective polarization
Respondents were asked to what extent they agreed with the following two statements:
I find it easier to relate to people if I agree with them politically.
I find it harder to relate to people if I disagree with them politically.
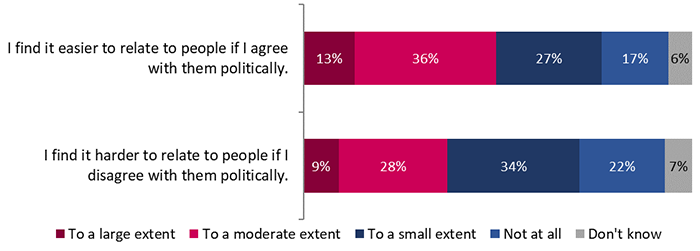
Respondents more often expressed feeling an affinity toward those they agreed with politically rather than an aversion to those with whom they disagreed: around half (49%) of respondents agreed to a large or moderate extent that they find it easier to relate to people if they agree with them politically, including 13% who agreed to a large extent; 38% agreed that they find it harder to relate to people if they disagree with them politically, including 9% who agreed to a large extent.
Figure 21: Perceived ease/difficulty of relating to people based on political agreement/disagreement – detailed March 2023 results
Q: Thinking about Canadians you might agree or disagree with politically, to what extent do you agree with the following statements? Base: All respondents (n=2,505).
Note: As this question was added in March 2023, no comparisons are available.
Text version of "Figure 21: Perceived ease/difficulty of relating to people based on political agreement/disagreement – detailed March 2023 results"
This graph shows agreement levels with statements regarding affective polarization. The breakdown is as follows:
I find it easier to relate to people if I agree with them politically.
To a large extent: 13%;
To a moderate extent: 36%;
To a small extent: 27%;
Not at all: 17%;
Don't know: 6%.
I find it harder to relate to people if I disagree with them politically.
To a large extent: 9%;
To a moderate extent: 28%;
To a small extent: 34%;
Not at all: 22%;
Don't know: 7%.
The responses to both statements were added to develop a measure of affective political polarization, where a person is considered to feel more strongly polarized in how they relate to others politically the more they feel an affinity toward those they agree with politically while also feeling an aversion toward those with whom they disagree.4
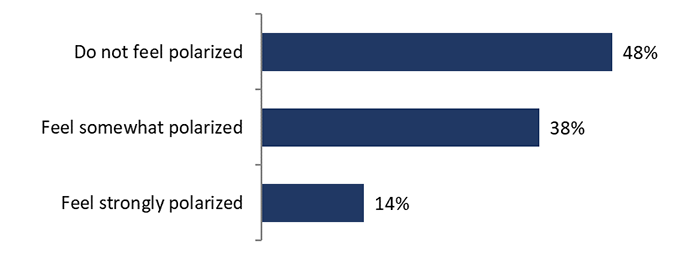
Based on this definition, around half (48%) of Canadian electors did not feel polarized in how they relate to other Canadians, in that they did not find it easier to relate to those they agreed with politically, nor did they find it harder to relate to those with whom they disagreed. On the other hand, a minority of 14% felt strongly polarized, meaning they found it easier to relate to those they agreed with politically to a large or moderate extent, while also agreeing to a similar extent that it was harder for them to relate to those with whom they disagreed. Over a third (38%) felt somewhat polarized, falling in the middle of the two groups.
Figure 22: Affective polarization
Q: Thinking about Canadians you might agree or disagree with politically, to what extent do you agree with the following statements? Base: All respondents (n=2,505).
Note: Question added in March 2023, no tracking available.
Text version of "Figure 22: Affective polarization "
This graph shows the distribution of polarization scores among Canadian electors. The breakdown is as follows:
Do not feel polarized, score of 0 to 2: 48%;
Feel somewhat polarized, score of 3 to 4: 38%;
Feel strongly polarized, score of 5 to 6: 14%.
The following subgroups were more or less likely to feel strongly polarized in how they related to others politically:
18 to 34-year-olds were more likely to feel strongly polarized (17%), while those 55 years and older were less likely (12%).
Respondents who are interested in politics (16%) were more likely to feel strongly polarized than those who are not interested in politics (9%).
Those with no conspiracy beliefs (18%) or strong conspiracy beliefs (20%) were more likely to feel strongly polarized, while those with mixed conspiracy beliefs were less likely (10%).
People who rarely see news about politics from any origin were less likely to feel strongly polarized (10%) than all those who often see news about Canadian, U.S., or world politics.
Trust in people
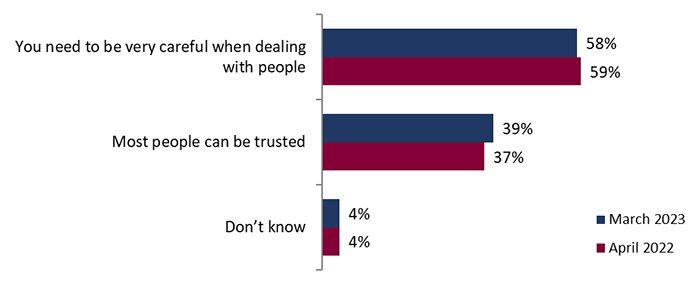
A majority (58%) of electors said that, generally speaking, they need to be careful when dealing with people, while almost four in 10 (39%) said that most people can be trusted. Results remain stable since April 2022.
Figure 23: Trust in people
Q: Generally speaking, would you say that most people can be trusted, or that you need to be very careful when dealing with people? Base: All respondents (n=2,505).
Note: Question added in wave 2 in April 2022.
Text version of "Figure 23: Trust in people"
This graph shows respondents' attitudes regarding trusting people. The breakdown is as follows:
March 2023:
You need to be very careful when dealing with people: 58%;
Most people can be trusted: 39%;
Don't know: 4%.
April 2022:
You need to be very careful when dealing with people: 59%;
Most people can be trusted: 37%;
Don't know: 4%.
The following subgroups were more or less likely to think that most people can be trusted:
Men (41%) were more likely to think that most people can be trusted than women (36%).
Respondents aged 55 and older (48%) were more likely to say that most people can be trusted, while those aged 18–34 (31%) and 35–54 (32%) were less likely.
Respondents with at least some university education (44%) were more likely to say that most people can be trusted, while those with some college or trade education (35%) or high school or less (29%) were less likely.
Respondents who are interested in politics (44%) were more likely to say that most people can be trusted than those who are not interested (26%).
Habitual voters (43%) were more likely to say that most people can be trusted than infrequent voters (25%).
Respondents who voted in the 2021 GE (43%) were more likely to say that most people can be trusted than those who were eligible but did not vote (26%).
Respondents with knowledge of provincial and federal powers (42%) were more likely to say that most people can be trusted than those without this knowledge (26%).
Respondents with no conspiracy beliefs (55%) were more likely to say that most people can be trusted, while those with mixed (32%) or strong (22%) conspiracy beliefs were less likely to do so.
Respondents who often see news about Canadian politics (43%) were more likely to say that most people can be trusted, while than those who often see news about U.S./world politics but rarely see news about Canadian politics (28%) and those who rarely see news about politics from any origin (20%) were less likely to do so.
Belief in government conspiracy theories
Belief in broad conspiracy theories about government remained similar in March 2023 compared with April 2022, as less than half of respondents accepted each of the theories presented as being probably or definitely true. The most accepted theory (42%) was that certain significant events have been the result of the activity of a small group who secretly manipulate world events, with 10% thinking it was definitely true and 32% probably true. About one-third (32%) thought that experiments involving new drugs or technologies are routinely carried out on the public without their knowledge (9% definitely true, 23% probably true). One in five (20%) Canadian electors thought that the government is trying to cover up the link between vaccines and autism (6% definitely true, 14% probably true).
Compared with April 2022, similar proportions of respondents in March 2023 accepted each of the conspiracy theories as true; however, a significantly lower proportion of respondents believed it is definitely false that the government is trying to cover up a link between vaccines and autism in March 2023 (45% versus 50% in April 2022).
Figure 24: Belief in conspiracy theories – tracking
Text version of "Figure 24: Belief in conspiracy theories – tracking"
This graph shows the evolution of respondents' opinions as to the veracity of certain conspiracy theories. The breakdown is as follows:
March 2023:
Certain significant events have been the result of the activity of a small group who secretly manipulate world events: 42%;
Experiments involving new drugs or technologies are routinely carried out on the public without their knowledge or consent: 32%;
The government is trying to cover up the link between vaccines and autism: 20%.
April 2022:
Certain significant events have been the result of the activity of a small group who secretly manipulate world events: 41%;
Experiments involving new drugs or technologies are routinely carried out on the public without their knowledge or consent: 32%;
The government is trying to cover up the link between vaccines and autism: 18%.
April 2021:
Certain significant events have been the result of the activity of a small group who secretly manipulate world events: 40%;
Experiments involving new drugs or technologies are routinely carried out on the public without their knowledge or consent: 30%;
The government is trying to cover up the link between vaccines and autism: 17%.
Figure 25: Belief in conspiracy theories – Detailed March 2023 results
Q: There is often debate about whether or not the public is told the whole truth about various important issues. Please indicate the degree to which you believe each statement is true or false? Base: All respondents (n=2,505).
Text version of "Figure 25: Belief in conspiracy theories – Detailed March 2023 results"
This graph shows the respondents' opinions as to the veracity of certain conspiracy theories. The distribution is as follows:
Certain significant events have been the result of the activity of a small group who secretly manipulate world events.
Definitely true: 10%;
Probably true: 32%;
Probably false: 24%;
Definitely false: 21%;
Don't know: 13%.
Experiments involving new drugs or technologies are routinely carried out on the public without their knowledge or consent.
Definitely true: 9%;
Probably true: 23%;
Probably false: 28%;
Definitely false: 29%;
Don't know: 12%.
The government is trying to cover up the link between vaccines and autism.
Definitely true: 6%;
Probably true: 14%;
Probably false: 20%;
Definitely false: 45%;
Don't know: 15%.
The following subgroups were more or less likely to think that the statement "certain significant events have been the result of the activity of a small group who secretly manipulate world events" was definitely or probably true:
Respondents living in rural or small-town areas (45%) were more likely to accept this as true than those living in urban or suburban areas (40%).
Respondents with a high school education or less (48%) and those with some college or trade school (48%) were more likely to accept this as true, while those with some university education (35%) were less likely to accept it.
Immigrant electors (47%) were more likely to accept this as true than Canadian-born electors (41%).
Infrequent voters (46%) were more likely to accept this as true than habitual voters (41%).
Respondents who do not have knowledge of federal and provincial powers (51%) were more likely to accept this as true than those who do have this knowledge (39%).
Respondents who tend to be distrustful of people (49%) were more likely to accept this as true than those who tend to be trusting (33%).
Respondents who felt somewhat polarized politically (47%) were more likely to accept this as true, while those who do not feel polarized (39%) were less likely.
The following subgroups were more or less likely to think that the statement "experiments involving new drugs or technologies are routinely carried out on the public without their knowledge or consent" is definitely or probably true:
Electors aged 18–34 (38%) and 35–54 (36%) were more likely to accept this as true, while electors aged 55 and older (25%) were less likely.
Ontario respondents (36%) were more likely to accept this as true than Quebec electors (26%).
Respondents with a high school or less education (41%) and those with a college-level education (35%) were more likely to accept this as true, while those with a university education (27%) were less likely to do so.
Indigenous electors (45%) were more likely to accept this as true than non-Indigenous electors (31%).
Immigrant electors (40%) were more likely to accept this as true than Canadian-born electors (30%).
Infrequent voters (45%) were more likely to accept this as true than habitual voters (28%).
Respondents who do not have knowledge of federal and provincial powers (47%) were more likely to accept this as true than those who do have this knowledge (28%).
Respondents who tend to be distrustful of people (40%) were more likely to accept this as true than those who tend to be trusting (21%).
The following subgroups were more or less likely to think that the statement "The government is trying to cover up the link between vaccines and autism" is definitely or probably true:
Electors aged 18–34 (23%) and 35–54 (25%) were more likely to accept this as true, while electors 55 and older (15%) were less likely.
Electors living in Ontario (23%) were more likely to accept this as true, while electors living in Quebec (15%) were less likely.
Respondents living in rural or small-town areas (23%) were more likely to accept this as true than those living in urban or suburban areas (19%).
Respondents with a high school or less education (29%) were more likely to accept this as true, while those with at least some university education (15%) were less likely.
Indigenous electors (34%) were more likely to accept this as true than non-Indigenous electors (19%).
Immigrant electors (26%) were more likely to accept this as true than non-immigrant electors (18%).
Infrequent voters (33%) were more likely to accept this as true than habitual voters (16%).
Respondents who do not know provincial and federal powers (34%) were more likely to accept this as true than those who do (16%).
Respondents who tend to be distrustful of people (25%) were more likely to accept this as true than those who tend to be trusting (13%).
Respondents who feel somewhat (23%) or strongly (26%) polarized politically were more likely to accept this as true, while those who do not feel polarized (17%) were less likely.
Respondents were categorized as having strong, mixed, or no conspiracy beliefs, where those who accepted all statements as at least probably true or any two statements as definitely true were considered to have strong conspiracy beliefs, while those who rejected all of the statements as probably or definitely false were considered to have no beliefs, and all others were considered to have mixed beliefs. Based on this definition, 16% of respondents in March 2023 were identified as having strong conspiracy beliefs, 48% had mixed beliefs, and 36% had no beliefs.
Footnotes
1 "Habitual voters" means those who reported that they have voted in all or most elections (municipal, provincial and federal) since they became eligible to vote, while "infrequent voters" voted in only some or none of them.
2 A federal general election was held on September 20, 2021, i.e. between the April 2021 and April 2022 survey waves.
3Details of subgroup differences in trust in other institutions are available in the banner tables published with this report.
4The responses to each statement were assigned a score ranging from 0 ("not at all") to 3 ("to a large extent") which were added to create a total affective polarization score with a range from 0 to 6. Scores of 5–6 were considered to indicate feeling strongly polarized, 3–4 feeling somewhat polarized, and 0–2 not feeling polarized.