|
|
|||||||||||||||||||||||||||||||||||||||||||||||||||||||||||||||||||||||||||||||||||||||||||||||||||||||||||||||||||||||||||||||||||||||||||||||||||||||||||||||||||||||||||||||||||||||||||||||||||||||||||||||||||||||||||||||||||||||||||||||||||||||||||||||||||||||||||||||||||||||||||||||||||||||||||||||||||||||||||||||||||||||||||||||||||||||||||||||||||||||||||||||||||||||||||||||||||||||||||||||||||||||||||||||||||||||||||||||||||||||||||||||||||||||||||||||||||||||||||||||||||||||||||||||||||||||||||||||||||||||||||||||||||||||||||||||||||||||||||||||||||||||||||||||||||||||||||||||||||||||||||||||||||||||||||||||||||||||||||||||||||||||||||||||||||||||||||||||||||||||||||||||||||||||||||||||||||||||||||||||||||||||||||||||||||||||||||||||||||||||||||||||||||||||||||||||||||||||||||||||||||||||||||||||||||||||||||||||||||||||||||||||||||||||||||||||||||||||||||||||||||||||||||||||||||||||||||||||||||||||||||||||||||||||||||||||||||||||||||||||||||||||||||||||||||||||||||||||||||||||
|
|
 |
||||||||||||||||||||||||||||||||||||||||||||||||||||||||||||||||||||||||||||||||||||||||||||||||||||||||||||||||||||||||||||||||||||||||||||||||||||||||||||||||||||||||||||||||||||||||||||||||||||||||||||||||||||||||||||||||||||||||||||||||||||||||||||||||||||||||||||||||||||||||||||||||||||||||||||||||||||||||||||||||||||||||||||||||||||||||||||||||||||||||||||||||||||||||||||||||||||||||||||||||||||||||||||||||||||||||||||||||||||||||||||||||||||||||||||||||||||||||||||||||||||||||||||||||||||||||||||||||||||||||||||||||||||||||||||||||||||||||||||||||||||||||||||||||||||||||||||||||||||||||||||||||||||||||||||||||||||||||||||||||||||||||||||||||||||||||||||||||||||||||||||||||||||||||||||||||||||||||||||||||||||||||||||||||||||||||||||||||||||||||||||||||||||||||||||||||||||||||||||||||||||||||||||||||||||||||||||||||||||||||||||||||||||||||||||||||||||||||||||||||||||||||||||||||||||||||||||||||||||||||||||||||||||||||||||||||||||||||||||||||||||||||||||||||||||||||||||||||||||||
|
Slot
machine structural characteristics:
Distorted
player views of payback percentages Kevin A.
Harrigan, E-mail: kevinh@uwaterloo.ca Abstract This paper presents a sample three-reel
three-coin slot machine game with a bonus for three coins, and a true payback
percentage of 85.6% when one or two coins are wagered and 92.5% when three
coins are wagered. The player sees the winning or losing combination of three
symbols on the payline as well as (a) the physical reels as they scroll by
and (b) what is just above and just below the payline at the end of play. An
analysis of this game shows that observing the physical reels and what is
just above and just below the payline indicates that the slot machine would
lose money, and thus the player would make money, as the game would have a payback
percentage in the range of 192%–486% if this reflected reality. The
paper concludes by discussing the results of the analysis in terms of gaming
regulations and problem gambling. Keywords: slot machine, probability, randomness,
virtual reels, gaming regulations, problem gambling Introduction
The payback percentage of a slot machine is
determined by a computer program inside the slot machine. The underlying
algorithms that the computer uses to create a slot machine game have been
described by Turner and Horbay (2004) in their paper directed toward
counsellors who treat and researchers who study problem gambling. The
algorithms are also documented in articles in other disciplines, such as the
gaming industry papers by Locke (2001) and The payback percentage of a slot machine game
cannot be determined by examining (a) the symbols on the physical reels in
the slot machine or (b) what is displayed just above or just below the
payline in the payline window at the end of a play. The purpose of this paper
is to use a sample slot machine game to determine the difference between the
true payback percentage, as determined by the computer, and the payback
percentage as indicated (a) on the physical reels and (b) by what is
displayed just above or just below the payline in the payline window at the
end of a play. The difference between the true payback
percentage and the payback percentage as indicated on the physical reels will
be termed the physical reel distortion factor (PRDF). The difference between
the true payback percentage and what the player sees just above and just
below the payline in the payline window will be referred to as the payline
window distortion factor above/below (PWDFa and PWDFb, respectively). The paper is written to help problem gambling
researchers better understand how slot machines can be random and yet
guarantee that the physical reel distortion and the payline window
distortions do exist. To do this analysis, a slot machine pay table
is needed. The manufacturers of slot machines and the jurisdictions in which
they are located do not make the pay tables publicly available. Thus, a
sample slot machine pay table detailed by Wilson's
seven articles in Slot Tech Magazine is used (Wilson
,
2003, 2004a, 2004b, 2004c, 2004d, 2004e, 2004f). It is a three-reel
three-coin slot machine with a bonus for the maximum bet of three coins.
Although there are many different slot machine games available on the market,
Wilson chose to document a simple three-reel three-coin machine to keep the
calculations "simple and easy" (Wilson, 2003, p. 12). Using the sample slot machine from
PRDF
Until the mid-1980s, the true payback
percentage on a slot machine could be calculated using the physical reels.
Older, mechanical slot machines were built so that each symbol on each reel
had an equal chance of occurring on the payline. The reels commonly had 22
stops, so the total number of reel combinations on the payline in a
three-reel mechanical slot machine was 10,648 (22 × 22 × 22).
When computers were introduced into slot
machines, the computer randomly controlled the outcome with an equivalent
number of combinations as the mechanical slot machines had, so that a slot
machine with 22 stops per reel would continue to have 10,648 reel
combinations on the payline. The technique the computer used for doing this
was patented by Saxton (1978) and used a straightforward mapping of random
numbers to the 22 stops. In this section, the payback percentage of a
sample slot machine game is calculated using the physical reels as though the
physical reels represented the odds as they did in the older, mechanical slot
machines. The game Table 1 Layout of the 22 symbols on the
physical reels
For this sample slot machine, the pay table
in Table 2 contains the pay glass information—the winning combinations
and what they pay. Table 2 shows, for example, that three double 7 symbols on
the payline pays 500 credits if one coin is wagered, 1,000 Table 2 Pay table (using the 22 stops on
the physical reels)
credits if two coins are wagered, and a bonus
jackpot of 6,000 credits if three coins are wagered. Three double 7 symbols
is the only winning combination with a bonus for the third coin. All other
winning combinations are linear payouts, with two and three coins paying two
and three times as much as one coin would. Calculating
the odds using the physical reels Table 2 shows what the pay table for this
slot machine would be if the physical reels were used to determine the true
odds. The calculations for the top three winning combinations will be
discussed here. There are eight combinations of three double
7 symbols on the payline because there are two double 7 symbols on each reel
(2 × 2 × 2). Thus, the chance of getting any combination of three double 7
symbols is 8 out of 10,648, the total number of reel combinations. There are
three single 7 symbols on each reel, thus there are 27 combinations of three
single 7 symbols on the payline (3 × 3 × 3) out of 10,648 total reel
combinations. Any three 7s is a winning combination. There
are five 7s on each reel (two double 7 symbols and three single 7 symbols),
giving 125 reel combinations of any three 7s (5 × 5 × 5) out of 10,648 total
reel combinations. However, slot machines pay only the highest amount for any
combination of 7s, so we have to subtract from the 125 combinations the eight
occurrences of three double 7 symbols on the payline and the 27 occurrences
of three single 7 symbols on the payline,
leaving 90 combinations (out of 10,648 total reel combinations) that would
pay for any three 7s (125 – 8 – 27). Payback
percentage using the physical reels The payback percentage is the average amount
that is paid on each play. For example, a payback percentage of 90.0% means
that, on average, the slot machine pays out 90.0% of the amount that was
wagered. Table 2 shows the calculation of the payback percentage as if
physical reels were used to determine the payback percentage. With 22 stops,
the total number of reel combinations is 10,648 (22 × 22 × 22). For one coin
wagered, the payback over these 10,648 reel combinations is 19,650 credits,
yielding a payback percentage of 185% (19,650/10,648). The payback percentage
for two coins is also 185% (39,300/21,296). For three coins, the total
wagered over the 10,648 combinations is 31,944 (10,648 × 3) and the payout is
94,950, yielding a payback percentage of 297% (94,950/31,944). If the
physical reels accurately reflected the outcome, the casino would lose money
on this slot machine, and players, on average, would make money. But slot machines make money. Gross gaming
profits in A summary
of this section This section has shown that the physical
reels on a sample slot machine would indicate that the player makes, on
average, 185% or 297% of his or her wager and thus the machine loses money.
However, slot machines make money, so this cannot be true. The next section details how virtual reel
mapping determines the true payback percentage. This information is
complementary to and expands upon the description of virtual reel mapping in
Turner and Horbay (2004). Virtual reel mapping is used to determine the
outcome, and the physical reels are just used as displays to inform the
player whether he or she has won or lost. Table 3 Layout of the 64 symbols on the
virtual reels
Virtual
reel mapping The main point of this section is to show what
the actual pay table is for this sample slot machine, so that we can compare
the true payback percentage with the fact that the A now-expired US patent, called the Telnaes
patent (Telnaes, 1984), provides the foundational algorithm for how modern
slot machines use a computer to determine the outcome and then display the
result using the physical reels on the slot machine. In the background of the
invention section of his patent, Telnaes states, "it is important to
make a machine that is perceived to present greater chances of payoff than it
actually has within the legal limitations that games of chance must
operate." Before its expiry, the Telnaes patent was owned by the slot
machine manufacturer International Game Technology (Wilson, 2004a, p. 19) and
was licensed to other manufacturers. In his patent, Telnaes did not use the
term "virtual reel mapping," but this is the term used now to describe
his algorithm. Maida
(1997, p. 45) describes the Telnaes patent as follows: This method alters the odds of hitting any
particular combination. The virtual reel may have any range of numbers from one
to infinity. (As a practical manner, numbers greater than 512 have not been
attempted.) Each number of the range is "mapped" to a range of 1 to
22—the number of symbols on the physical reel. The random-number generator chooses one
number for each reel and then "maps" it to the physical reel. The
reel spins to that position, and the machine evaluates the ending stop
positions to determine whether a win or a loss has occurred. This method dominates the technology
currently used in industry: more than 80% of spinning-reel slot machines use
this algorithm. In his articles, Looking at reel 1 in Table 3, we see that
virtual stops 1 to 3 are mapped to physical stop 1, virtual stops 4 and 5 are
mapped to physical stop 2, virtual stop 6 is mapped to physical stop 3, and
so on until all 64 virtual stops are mapped to all 22 physical stops. Reels 2
and 3 each have their own mapping, as shown in Table 3. It was noted earlier
that the three physical reels on our sample slot machine are identical, but
Table 3 shows that the virtual reels underlying them are not identical. A comparison of the virtual reels and the
physical reels is shown in Table 4. On all three physical reels the
highest-paying symbol, double 7, occurs 9% of the time (2 out of 22), whereas
on virtual reels one and two double 7s occur 3% of the time (2 out of 64) and
on virtual reel three double 7s occur 4.7% of the time (3 out of 64). Thus,
for reel 1, comparing the virtual stops with the physical stops shows that
double 7 occurs 291% more often on the physical reel than on the virtual reel
(2 out of 22 (9%) versus 2 out of 64 (3%)). Conversely, we see that lower-paying symbols
occur on the virtual reels more often than they appear on the physical reels.
The lowest-paying symbol is single bar. It occurs 9% of the time on each of
the three physical reels (2 out of 22), whereas it appears 22% of the time on
virtual reel 1 (14 out of 64). Thus, for reel 1 the single bar occurs on the
virtual reel only 42% of the times that it occurs on the physical reel (2 out
of 22 (9%) versus 14 out of 64 (22%)). Table 4 Comparison
of virtual reels and physical reels
To determine the true payback percentage for this
game, we must do the same calculations that were done in Table 2 in the PRDF
section, but instead of using the 22 stops on the physical reels in the
calculations we use the 64 stops on the virtual reels. The calculations and
results for the virtual reels are shown in Table 5. Table 5 Pay table (using the virtual
reels)
Table 5 shows that the true payback
percentage for this slot machine is 85.6% if one or two coins are played and
92.5% if three coins are played. Our results are the same as Summary of
this section Many variations of slot machine games are on
the market (thousands have been approved in PWDF This section discusses the difference between
the true payback percentage and what the player sees just above or just below
the payline in the payline window. The issue is first discussed and then the
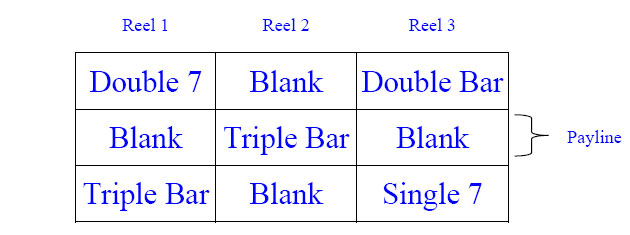
sample slot machine from When a player plays a slot machine, he or she
either wins or loses on each play, and the results are displayed on the
payline. This section concerns itself with what three symbols are displayed
in the payline window just above and just below the payline. Figure 1 shows a
sample of a payline window on a slot machine. On the payline are the symbols
or blanks (in this case, blank on reel 1, triple bar on reel 2, and blank on
reel 3). Also typical, as can be seen in Figure 1, is that above and below
the payline the player can see one or two symbols on each reel for a total of
three to five symbols on each reel (i.e., one symbol on the payline, one or
two symbols above the payline, and one or two symbols below the payline).
This total area of view is called the payline window. What we are seeing in
Figure 1 is physical stops 19 to 21 on reel 1, physical stops 8 to 10 on reel
2, and physical stops 1 to 3 on reel 3. Figure
1. Sample payline
window.
Manufacturers can design the game so that the
symbols just above and just below the payline are unequally distributed so
that (a) higher-paying symbols appear more often just above or just below the
payline than they would by chance and, conversely, (b) lower-paying symbols
appear less often than they would by chance. We can see how this is done by
examining in more detail the virtual reel in Table 3. For this discussion we
will assume that we can see three symbols in the payline window for each
reel—one symbol on the payline, one above the payline, and one below
the payline—although this is a design that can vary from machine to
machine. The overall issues of how and why the In Table 3 we see that on reel 1 the virtual
stops 16 to 19 are blanks and are all mapped to the physical stop 6. Virtual
stop 20 is a double 7 and is mapped to physical stop 7. Virtual stops 21 to
24 are blanks and are all mapped to physical stop 8. Only two double 7
symbols are on reel 1. The other is at virtual stop 56. It is also similarly
surrounded by eight blanks on the virtual reel (i.e., virtual stops 52 to 55
and 57 to 60). We know from Table 3 that double 7 occurs on
the payline two times (i.e., virtual stops 20 and 56) out of a possible 64;
this is a 3.1% chance of occurring. We can see in Table 6 that because of the
mapping of the virtual reel, double 7 will appear just above the payline 8
out of 64 times (12.5%) because the double 7 in virtual stop 20 (i.e.,
physical stop 7) will occur just above the payline every time virtual stops
21 to 24 (i.e., physical stop 8) appear on the payline and the double 7 in
virtual stop 56 (i.e., physical stop 19) will appear just above the payline
every time virtual stops 57 to 60 (i.e., physical stop 20) appear on the
payline. Table 6 shows for each symbol on reel 1 the
number of times it will appear just above the payline. It is important to
note in Table 6 that column one is showing the virtual stop that is on the
payline, whereas column two is showing what is just above the payline. We see
from the table that on reel 1, when virtual stops 1 to 3 are on the payline,
then a blank will be just above the payline; when virtual stops 4 and 5 are
on the payline, the double bar will be just above the payline; and so on to
see what is just above the payline when each of the 64 stops is on the
payline. Table 6 can be cross-referenced to Table 3, as column one in both
tables is referring to the virtual stops. The difference between the two
tables is that columns two to four in Table 3 are referring to what is on the
payline, which is shown in the articles by For higher-paying symbols, such as double 7,
the number of times the symbols appear just above the payline is greater than
it would be by chance alone, whereas for the lower-paying symbols, such as
single bar, the chances of that symbol appearing just above the payline are
lower than they would be by chance alone. Table 7 shows the results of an analysis to
determine the payback percentage for the three symbols occurring just above
the payline as if those symbols were used to determine the game outcome.
Observing the three symbols just above the payline would indicate that the
slot machine has a payback percentage of 193.0% on one and two coins and a
payback percentage of 485.9% on three coins.
Table 6
Layout of the 64 symbols just
above the payline on Reel 1
Table 7 Pay table (symbols just above the
payline)
A detailed analysis is not shown here for
just below the payline, but those calculations have been done and the results
are that observing the three symbols just below the payline would indicate
that the slot machine has a payback percentage of 191.5% on one and two coins
and a payback percentage of 484.5% on three coins. Summary of
this section As discussed earlier, observing the physical
reels does not reveal to the player anything about the actual odds, as the
odds are designed into the virtual reel mapping. What this section has shown
is that not only does virtual reel mapping obscure the odds, but also the
mapping itself intentionally increases the probability that the winning
combinations will appear disproportionately higher just above and just below
the payline. The following section will discuss the PRDF
and PWDFs relative to gaming regulations and problem gambling. Discussion
of gaming regulations and problem gambling
Table 8 includes a summary of the distortions
that have been presented in separate sections in this paper. The slot player
can see the physical reels as they scroll by but cannot see the virtual
reels. The player cannot see the algorithm that is used to determine the
result, so the player has no way of knowing that the results just above and
just below the payline are intentionally distorted so that in nonwinning
plays the higher-paying symbols appear more often than they would by chance
alone. Conversely, the lower-paying symbols appear less often than they would
by chance alone.
Summary of payback percentages
Gaming regulations
[2](b)
For gaming devices that are representative of live gambling games, the
mathematical probability of a symbol or other element appearing in a game
outcome must be equal to the mathematical probability of that symbol or
element occurring in the live gambling game. For other gaming devices, the
mathematical probability of a symbol appearing in a position in any game
outcome must be constant. 3.
Must display an accurate representation of the game outcome. After selection
of the game outcome, the gaming device must not make a variable secondary
decision which affects the result shown to the player. It is important to note that Regulation
14.040 (2b and 3) is referring to gaming devices in general and is not
specific to slot machines. It is the responsibility of regulators to
interpret the regulations for any given gaming device. For slot machines, the
regulators must be aware of the distortions described in this paper, as the
design of the distortions is in the par sheets, and the regulators have
decided that these distortions are acceptable within Regulation 14.040 (2b
and 3). Thus the regulators are interpreting the
regulations to mean that games that include the PRDFs and PWDFs do meet the
requirement in 14.040(3) that the game "Must display an accurate
representation of the game outcome." An issue that arises is whether slot machines
that have distortions as described in this paper should be legal. This paper does
not address this issue directly. Rather, the intent of this paper is to
document the distortions, and the corresponding regulations, so that problem
gambling researchers may study such distortions to determine if slot machines
with such distortions increase the likelihood of problem gambling and should
be banned by (a) modifying and/or (b) reinterpreting the existing
regulations. Problem
gambling Some gamblers may gamble without ever having
a gambling problem, while others may develop a gambling problem. The Ontario
Problem Gambling Research Centre's (OPGRC) problem gambling framework can be
used to explain or contextualize a dynamic environment in which gamblers may
move between low risk and high risk and also move between the presence of gambling
problems and not (OPGRC, 2006). The OPGRC framework aligns the entire
population in a continuum defined by risks and problems. It shows that all
gamblers have direct and indirect risk factors and any given gamblers may or
may not have a gambling problem at any given time. An important aspect of the
framework is that it expresses risk and prevalence as percentages on a
continuum. Any individual gambler has a probability of experiencing a
problem, and that probability increases as the number of risk factors
increases. The OPGRC framework encapsulates the Pathways
Model (Blaszczynski, 2000; Blaszczynski & Nower, 2002), which stresses
that a large number of factors are important to be able to predict whether a
gambler will develop a problem. The larger the number of risk factors that
exist for an individual, the higher is the probability that the individual
will develop a problem. The OPGRC framework separates direct risk
into (a) risk practices and (b) risk cognitions. Risk practices include items
such as regularly spending more time and money gambling than intended,
whereas risk cognitions are "serious misunderstandings about the nature
of probability and randomness" (OPGRC, 2006). According to the OPGRC
framework, risk cognitions "are thoughts and beliefs held by gamblers
that support the adoption and maintenance of risk practices" (OPGRC,
2006). Although not stated specifically in the OPGRC framework, we
believe that various EGM structural characteristics, such as near misses,
function as indirect risk factors and may lead to faulty risk cognitions. One aspect that deserves attention is what
characteristics of a game's design increase risk cognitions. By identifying the particular structural
characteristics it may be possible to see how (a) needs are identified; (b) information
about gambling is presented (or perhaps misrepresented), and (c) cognitions
are influenced and distorted. Showing the existence of such relationships has
great practical importance. Not only could potentially "dangerous"
forms of gambling be identified, but effective and selective legislation
could be formulated. A slot machine structural characteristic that
has been given attention by problem gambling researchers is the "near
miss," which Webster's Third New International Dictionary (1993) broadly
defines as "something that falls just short of success" and
Griffiths defines as "failures that are close to being successful"
(1995, p. 23). In discussing the frequent occurrence of higher-paying symbols
above and below the payline in his sample game described in this paper,
Wilson said, "With this design the 7's will be either on the pay line or
slightly above or below it most of the time. While this gives the illusion
that the 7's have almost lined up on the pay line, it's the virtual reel that
tells the truth." (Wilson, 2004a, p. 21). Although Several studies have investigated slot
machine near misses. Strickland and Grote (1967) and Reid (1986) studied near
misses on the payline. The results of their controlled experiments showed
that near misses on the payline led to significantly longer playing times. Currently, electronic gambling machines make
up a large percentage of gaming industry profits. Studies also show that
among gamblers seeking treatment, use of electronic gambling machines tends
to be the most common form of gambling (Rush, Moxam Shaw, & Urbanoski,
2002; Becoña, Labrador, Echeburúa, & Ochoa, 1995; Wiebe & Cox, 2001).
Problem gamblers often exhibit
misunderstandings about their chances of winning (Wagenaar, 1988; Gaboury
& Ladouceur, 1989). The results of the current study suggest that the
machines themselves may be a source of some of their erroneous beliefs.
Further laboratory and field research is needed, focusing on the extent to
which PWDF (a & b) and PRDF may contribute to problematic gambling. References
Becoña,
E., Blaszczynski,
A. (2000). Pathways to pathological gambling: Identifying typologies.
Electronic Journal of Gambling Issues: eGambling, 1. Available at http://www.camh.net/egambling/issue1/feature/index.html
Blaszczynski,
A., & Nower, L. (2002). A pathways model of problem and pathological
gambling. Addiction, 97, 487–499. Cornish,
D.B. (1978). Gambling: A review of the literature and its implications for
policy and research. Gaboury,
A., & Ladouceur, R. (1989). Erroneous perceptions and gambling. Journal
of Social Behavior and Personality, 4, 411–420. Kassinove,
J., & Schare, M. (2001). Effects of the "near miss" and the
"big win" at persistence in slot machine gambling. Psychology of
Addictive Behaviors, 15, 155–158. Ladouceur,
R., & Sevigny, S. (2006). The impact of video lottery game speed on
gamblers. Journal of Gambling Issues, 17. Available at http://www.camh.net/egambling/issue17/ladouceur.html
Locke,
K. (2001, August). Above PAR. Slot Tech Magazine, 4–8. Maida,
J.R. (1997, July). From the laboratory: No more near misses. International
Gaming & Wagering Business, p. 45. Nevada Gaming
Commission. Regulations of the
Ontario Lottery
and Gaming Corporation (2006a). Annual Report 2004–2005.
Retrieved April 28, 2006, from http://www.olg.ca/assets/documents/annual_report/annual_report_04-05.pdf
Ontario Lottery
and Gaming Corporation (2006b). Fact Sheets. Retrieved June 12, 2006
from http://www.olg.ca/about/media/facts.jsp.
Ontario Problem
Gambling Research Centre (2006). Problem Gambling Framework. Retrieved
October 23, 2006 from http://www.gamblingresearch.org/framework.sz
Reid,
R.L. (1986). The psychology of the near miss. Journal of Gambling
Behavior, 2, 32–39. Rush,
B., Moxam Shaw, R., & Urbanoski, K. (2002). Characteristics of people
seeking help from specialized programs for the treatment of problem gambling
in Sack, Sack, Saxton,
J.C. (1978). Strickland,
L.H., & Grote, F. W. (1967). Temporal presentation of winning symbols and
slot machine playing. Journal of Experimental Psychology, 74,
10–13. Telnaes,
I.S. (1984). Turner,
N., & Horbay, R. (2004). How do slot machines and other electronic
gambling machines really work? Journal of Gambling Issues, 11.
Available at http://www.camh.net/egambling/issue11/jgi_11_turner_horbay.html
Wagenaar,
W.A. (1988). Paradoxes of gambling behaviour. Webster's
Third New International Dictionary (unabridged) (1993). Wiebe,
J.M.D., & Cox, B.J. (2001). A profile of Canadian adults seeking
treatment for gambling problems and comparisons with adults entering an
alcohol treatment program. Canadian Journal of Psychiatry, 46,
418–421.
Wilson,
J. (2003, December). Slot machine volatility index. Slot Tech Magazine,
10–17. Wilson,
J. (2004a, January). Virtual reels? Physical reels? Just the real truth. Slot
Tech Magazine, 18–22. Wilson,
J. (2004b, February). PAR excellence: Improve your edge. Slot Tech
Magazine, 16–23. Wilson, J.
(2004c, March). PAR excellence: Part 2. Slot Tech Magazine,
16–21. Wilson,
J. (2004d, April). PAR excellence: Part 3. Slot Tech Magazine,
20–26. Wilson,
J. (2004e, May). PAR excellence – Improving your game – Part IV. Slot
Tech Magazine, 21–24. Wilson,
J. (2004f, June). PAR excellence – Part V: The end is here! Slot
Tech Magazine, 24–29. ******* Manuscript
history: submitted: June 13, 2006; accepted: December 12, 2006. This article
was peer-reviewed. All URLs were available at the time of submission. For
correspondence: Kevin A. Harrigan, PhD,
Competing interests: None declared.
Ethics approval: Not required.
Funding: KH is employed at the
Kevin
A. Harrigan, PhD, is a research associate professor at the
|
|||||||||||||||||||||||||||||||||||||||||||||||||||||||||||||||||||||||||||||||||||||||||||||||||||||||||||||||||||||||||||||||||||||||||||||||||||||||||||||||||||||||||||||||||||||||||||||||||||||||||||||||||||||||||||||||||||||||||||||||||||||||||||||||||||||||||||||||||||||||||||||||||||||||||||||||||||||||||||||||||||||||||||||||||||||||||||||||||||||||||||||||||||||||||||||||||||||||||||||||||||||||||||||||||||||||||||||||||||||||||||||||||||||||||||||||||||||||||||||||||||||||||||||||||||||||||||||||||||||||||||||||||||||||||||||||||||||||||||||||||||||||||||||||||||||||||||||||||||||||||||||||||||||||||||||||||||||||||||||||||||||||||||||||||||||||||||||||||||||||||||||||||||||||||||||||||||||||||||||||||||||||||||||||||||||||||||||||||||||||||||||||||||||||||||||||||||||||||||||||||||||||||||||||||||||||||||||||||||||||||||||||||||||||||||||||||||||||||||||||||||||||||||||||||||||||||||||||||||||||||||||||||||||||||||||||||||||||||||||||||||||||||||||||||||||||||||||||||||||||
|
|
issue 20 — june 2007  |
contents | submissions | links | archive | subscribe
Please note that these links will always point to the current issue of JGI. To navigate previous issues, use the sidebar links near the top of the page.
Copyright © 1999-2007 The Centre for Addiction and Mental Health
Editorial Contact: Phil Lange
Join our list to be notified of new issues. Subscribe