|
|
||||||||
|
|
 |
|||||||
|
Mapping
the prevalence of problem gambling and its association with treatment
accessibility and proximity to gambling venues Brian Rush, 1,2,3
Scott Veldhuizen,1 & Edward Adlaf,3,4 1Health Systems Research and Consulting Unit, Centre for Addiction
and Mental Health, 2Department of Psychiatry, 3Department of Public Health Sciences, 4Public Health and Regulatory Policy, Centre for Addiction and Mental Health, Toronto, Canada
Abstract
This study examined geographic
variation in the prevalence of problem gambling in Regional
variation in prevalence of problem gambling was found in the province. Prevalence of problem gambling
was associated with many demographic characteristics, as well as mental disorders, co-occurring
substance abuse problems, and physical health status. Geographic access to
treatment was not associated with the risk of being a problem gambler.
However, proximity to gambling venues was marginally important in predicting
risk of problem gambling. Results are interpreted in the context of
needs-based planning of treatment and prevention programs for problem
gambling. Keywords: gambling
availability, geographic information systems, problem gambling prevalence Introduction
Spatial variation
in the prevalence and incidence of disease can quantify risks presented by
hazards, inform decisions about the allocation of treatment resources, and
help identify previously unknown risk factors. Interest in this area has been
increasing recently, and methods of spatial analysis are now widely used in
epidemiological research. Geographic information systems (GIS), used
principally as visualization tools, are also increasingly popular in public
health research. Both spatial analysis and GIS have been effectively applied
in many areas of health care, including psychiatry (e.g., Chaix, Spatial
variation of problem gambling in A substantial body of Canadian research now exists on the
occurrence, course, and treatment of problem gambling. A published review of
studies conducted in eight provinces reported that between 2.7% and 5.4% of
Canadian adults were problem or pathological gamblers in 1996 (National
Council of Welfare [NCW], 1996). Several surveys of In 2002, Statistics
Canada conducted cycle 1.2 of the Canadian Community Health Survey (CCHS
1.2), a large (n = 36,984) representative community survey of
Canadians aged 15 and older focused on mental health and well-being. CCHS 1.2
included a detailed inventory of gambling behaviour and an assessment for
problem gambling (Statistics Canada, 2003a; 2003b). These data have made it
possible to examine problem gambling at the population level—its
prevalence, risk factors, and distribution across demographic and socioeconomic
groups, as well as geographic variation. In this study, we examined
geographic differences across Ontario in rates of problem gambling, measured
the extent to which these differences are explained by known risk factors
(e.g., age, gender, comorbidity with mental and substance use disorders), and
tested the independent effects of two potential environmental risk factors:
exposure to gambling opportunities and accessibility of treatment. Although
our study design will not permit a causal interpretation, increased exposure
to gambling opportunities would be expected to be associated with higher
prevalence rates. Research on alcohol use and abuse, for example, has been
able to show at the population level that as the number of people in
treatment increases there is a net decline in indicators of alcohol-related
harms such as liver cirrhosis and suicide (Mann et al., 2005; Mann et al., in
press). Thus, we also predicted increased proximity to treatment venues to be
associated with lower prevalence rates, as a result of positive treatment
impact.
Methods Four sources
of a) Population survey data on the prevalence of
problem gambling CCHS
1.2 was a nationally representative community mental health survey conducted
by Statistics Canada between May and December of 2002. The survey
questionnaire included the CPGI, a measure of problem gambling appropriate
for use with the general population (Ferris &
Wynne, 2001. The
survey was targeted at the Canadian population aged 15 years or older living
in private dwellings, excluding full-time members of the Armed Forces as well
as individuals living in health care institutions, on First Nations (aboriginal)
reserves or government-owned land, in one of the three northern territories,
or in other remote regions. This sampling frame included 98% of the Canadian
population. The overall response rate for the survey was 77%, and the final
sample size was 36,984. The Ontario subsample used here numbers 13,184. Further details on the design
and methodology of the survey have been reported by Gravel and Beland (2005).
An important
characteristic of the assessment of problem gambling in CCHS 1.2 is that respondents
were screened out of the problem gambling section if they did not gamble with
a certain frequency. Modules for mood and anxiety disorders also used short
screens to avoid unnecessary interviews, but in these cases the screening
items corresponded to core symptoms of the disorder in question. In the
gambling module, however, individuals were screened out if they had not
gambled more than five times in the previous year, or if they volunteered
that they were "not a gambler" in response to the first question of
the CPGI. Current clinical definitions of problem gambling, like those of
substance use disorders, do not include a minimum frequency requirement, and
individuals who identify themselves as current nongamblers may still have
experienced problems in the previous year or with activities that may not be
popularly considered "gambling" (e.g., high-risk investments).
Although it is reasonable to expect that the majority of the excluded
respondents would not have met criteria for problem gambling, the impact of
this filtering process is unknown. Our
analysis defines problem gambling as a CPGI score of 3 or more. According to
the instrument's scoring guidelines, this includes moderate-risk gamblers
(CPGI score between 3 and 7) and problem gamblers (CPGI score between 8 and
27). Mood and anxiety disorders were identified using the World Mental Health
version of the Composite International Diagnostic Instrument (WMH-CIDI), a
widely used instrument in community surveys (Kessler & Üstün,
2004). Substance use problems are identified here by
the presence of one or more abuse or dependence criteria according to Diagnostic
and statistical manual of mental disorders (4th ed.) (American
Psychiatric Association, 1994) within the previous 12 months. b) Problem gambling treatment capacity
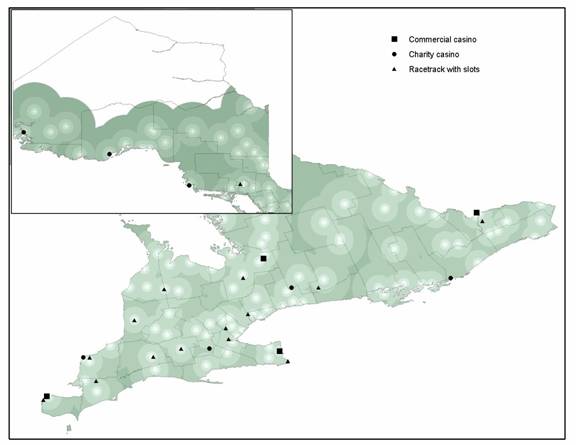
c) Location of casinos and racetracks with slots The analysis included 28 gambling venues
representing all commercial casinos (6), charity casinos (7), and racetracks
with slot machines (15) located within the province or nearby in neighbouring
provinces. Locations, opening dates, capacities, and other details were
obtained from the Ontario Lottery and Gaming Corporation, occasionally supplemented
from other sources where necessary. d) Spatial datasets Spatial data
were obtained principally from the Measuring exposure and
accessibility In order to
test possible effects of "exposure" to gambling venues and
accessibility of gambling treatment, it was necessary to quantify both of
these as proximity measures. In the case
of gambling, we concentrated on major gambling venues: commercial casinos,
charity casinos, and slots facilities at racetracks. These represent all
legal and permanent facilities in the province offering slot machines and
card gambling. These are the gambling habits cited as a primary problem by
the majority of problem gamblers in treatment (Urbanoski & Rush, 2006)
and by callers to the Ontario Problem Gambling Helpline. Locations of
gambling venues and treatment centres are mapped in Figure 1. Other common
gambling activities, such as lottery tickets and bingo, were not considered
because these are almost universally available, are more rarely cited as
problem activities by gamblers, are more strongly responsive to local demand
(making their inclusion as independent "risk factors" dubious), and
are extremely difficult to collect adequate data on. Gambling venues in In order to
quantify exposure to gambling, several variables were entered into logistic
regression models and combined into an index. These measures were
·
the natural
logarithm of the linear distance from each respondent to the nearest commercial
casino, to the nearest charity casino, and to the nearest slots facility,
where each was 200 km or less; ·
dummy variables
indicating distances greater than 200 km for each venue type; Initially, both the linear distance and its
transformation were included in the first measure, but the latter proved as
good a predictor as both together. Only gambling venues open for 90 days or
longer as of the respondent's survey date were included. This was an important
consideration in the case of the Thousand Islands Charity Casino, which
opened during the survey period, and the Georgian Downs racetrack, which
opened a slots facility late in 2001. Our use of a combined
proximity index was adopted as a compromise between flexibility and the need
to keep the number of statistical tests reasonable. A more complete method
would allow the exposure relationship itself to vary geographically (since
distance, for example, can be expected to be less of a deterrent in more
remote areas), but the limited sample size means that the number of tests
involved would quickly become problematic. Treatment
accessibility was similarly measured by
·
the distance to the
nearest treatment centre, ·
the capacity of
that centre, ·
the estimated
waiting time for assessment of problem gambling at that centre. Treatment
accessibility measures were calculated for each respondent by identifying the
nearest available treatment centre without demographic or other restrictions
that would have excluded him or her. This meant, for example, that centres
offering treatment for women only were not considered for male respondents. Six-digit postal codes
were used to assign latitude/longitude locations to respondents, making it
possible to treat individuals as "point" data. An external
geocoding service was used to obtain more precise locations for treatment
facilities and gambling venues, for which addresses were known. Linear
distance was used because respondent locations were not known exactly and available
road and rail network data were inadequate; attempts to estimate travel
barriers in more detail would, therefore, not have produced acceptable
results. Other geographic identifiers supplied with the CCHS 1.2 data made it
possible to group respondents by census metropolitan area (CMA) and health
region. CCHS 1.2 used a complex survey design. In order to obtain accurate
standard errors and significance tests, all models and bivariate tests were
bootstrapped using a set of replicate weights supplied by Statistics Canada.
The WesVar 4.2 software package was used for this purpose. Figure 1. Location of major gambling venues and treatment centre accessibility1 in 20022.
1Buffers are shown around gambling treatment centres. 2 Inset map
shows the northern part of the province Cluster scans
were performed with SaTScan 3.0, using survey weights rescaled to a mean of
one and divided by the overall survey design effect, which was 2.3. Mapping
and interpolation was done with ArcGIS 8.3 and 9.0. Analysis Describing
the geography of problem gambling in We used three
approaches to characterize spatial patterns of problem gambling in the
province. First, we calculated estimates and confidence intervals for those
existing regions that were both large enough to support stable estimates and
of some independent interest: CMAs and provincial health regions. In addition
to conventional tests of regional variation, we also performed a spatial
cluster scan for areas of high and low prevalence. The software used, SaTScan
3.0.5 (Kulldorf & Information Management Services, Inc., 2002), considers
the counts of cases and noncases in all possible clusters (circles of varying
sizes including one or more data points) within a region and reports the most
likely along with an estimate of relative risk and statistical significance.
Details on this process are available in Kulldorff (1997). Full cluster scan
results cannot be displayed because of disclosure issues raised by Statistics
Canada, but they functioned as a valuable check on the general regional
patterns observed. Testing gambling
availability and treatment accessibility as predictors of problem gambling Variables
previously shown to be associated with problem gambling and other important
control variables were tested against problem gambling "caseness"
in a series of bivariate tests. Health regions and CMAs were also tested in
this way. Along with
proximity measures, these variables were then entered into a series of
logistic regressions predicting caseness for problem gambling. Significance
for proximity variables was assessed as the difference in overall model fit,
with and without the exposure and "accessibility" variables,
respectively. The inclusion of multiple indicators of a single source of risk
has the effect of reducing this significance level; this penalty reflects the
risk of overfitting. Another limitation of this approach is that it is
difficult to represent the relationship between exposure and risk when the
former is defined by several different variables. In this analysis, the
possibility of reporting a dose-response relationship has been sacrificed in
favour of a broader test to establish the presence or absence of a
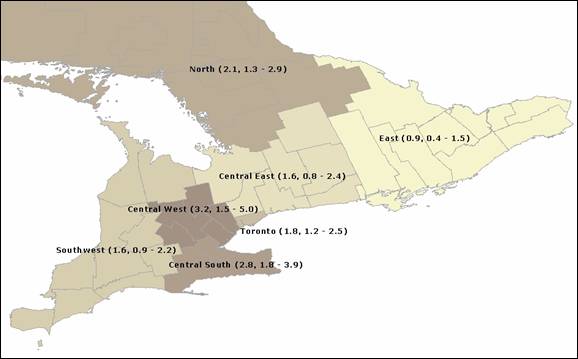
relationship. Results
Figure 2. Prevalence of problem gambling by public health unit (%, 95% CI)
Among
demographic and other predictor variables, problem gambling was
significantly, and independently, associated with male gender, current
employment, low education, being formerly married, having poor self-described
health, and having a substance use disorder (abuse or dependence) in the
previous 12 months (Table 1). The age variables (age and age squared)
indicated a nonlinear relationship, with increasing risk up to age 35 and
then declining thereafter. Odds ratios were above one for ages between 25 and
45. Variables indicating the presence of mood and anxiety disorders became
nonsignificant in the presence of the substance problem variable, with the
odds ratio for anxiety disorders, in particular, moving very close to one. No effect on risk
was observed for treatment accessibility (Table 2). However, the variables
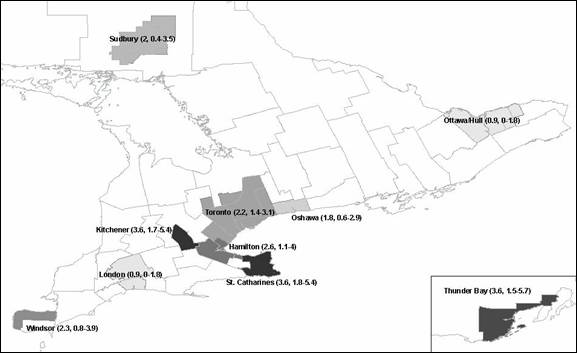
chosen to capture exposure to gambling venues had a modest, but significant,
positive association with being a problem gambler. Discussion Figure 3. Prevalence of problem gambling for major CMAs (%, 95% CI).
some surveys.
As researchers have acknowledged (e.g., Wiebe et al., 2006), nonresponse bias
is a considerable problem in gambling research: Respondents who do not gamble
may be disinclined to participate in dedicated surveys, which they may
perceive as irrelevant or uninteresting. This may be less important in the
case of CCHS 1.2, in which assessment of problem gambling was a small part of
a much larger questionnaire. While not without its limitations, CCHS 1.2 was
also carefully designed to be representative and combined a large sample
size, a well-validated instrument, and a reasonably good response rate. The
estimate it provides is, therefore, likely to be the best currently
obtainable.
There are
substantial regional variations in the prevalence of problem gambling in Table 1. Results
for base logistic regression model predicting problem gambling and for model
with regions added (odds ratios and 95% CIs)
**p
< 0.01; *p < 0.05. Table 2. Results
for model predicting problem gambling with proximity measures added (odds
ratios and 95% CIs)
**p
< 0.01; *p < 0.05. The elevated
rate for the Central West health region deserves further attention, however.
Small clusters of high rates were detected in the western suburbs of the GTA,
and individual CMAs partly within the region (Toronto, While it is
not possible to fully explain the observed regional differences in
prevalence, problem gambling appears to be modestly but significantly
associated with proximity to casinos and racetracks with slot facilities. As
we have noted, this relationship is difficult to interpret with confidence;
it is possible, for example, that geographic differences in unmeasured
variables may have confounded the association. Nevertheless, treatment data,
as we have noted, indicate that casino games are the most common primary
problem of people in treatment, and it is not difficult to accept that easy
access to these forms of gambling might constitute an independent risk factor
for problem gambling. Future research might provide more substantial evidence
on this question by making careful use of multiple community surveys to
detect emerging differences between areas with and without easy access to
casino gambling. In existing
research, the most consistently observed demographic correlates of problem
gambling in the general population have been male gender, living outside a
married/common-law relationship, and lower education (National Research
Council, 1999). Our findings are consistent with earlier reports in these
areas. Whereas younger age is usually associated with a higher risk of
problem gambling (National Research Council, 1999), some studies have reported
higher risk in the middle age categories (Smart & Ferris, 1996; Petry, Stinson, & Grant, 2005). We found a nonlinear relationship with age (peaking at
age 35) and submit that the association between problem gambling and age is
more complex than a comparison of younger versus older clients can fully
assess. Comparisons across studies are complicated, however, by differences
in measures and possibly by cohort effects. Previously
reported findings have been inconsistent with respect to employment status
and problem gambling, with many studies finding no association (National
Research Council, 1999), and others finding the unemployed to be more likely
to be problem gamblers (Abbott & Volberg, 1996). Our findings showed
problem gambling to be associated with being employed. The significance level
of this association is, however, marginal (p = 0.04) and, given the
number of other control variables included, would not survive a correction
for multiple tests.
Co-occurring
substance abuse is an important correlate of problem gambling in the present
sample, a finding consistent with previous work in both community and
clinical samples (Shaffer & Korn, 2002; Volberg, 1994; Cunningham-Williams,
Cottler, Compton, & Spitznagel, 1998; Shaffer, Freed,
& Healea, 2002;
Smart & Ferris, 1996; Spunt, Dupont,
Lesieur, Liberty, & Hunt, 1998). Like many other studies, we also found a strong bivariate
relationship between problem gambling and co-occurring mood and The relationship between problem gambling
and poor self-reported physical health status has been reported in other
studies, with samples drawn from methadone maintenance clinics (Weinstock,
Blanco, & Petry, 2006) and a nonrandom community sample of older adults
(Erickson, Molina, Ladd, Pietrzak, & Petry, 2005). In a general
population sample, Wiebe et al. (2001) reported that those with moderate and
severe gambling problems were more likely to report being under a doctor's
care for emotional or physical problems brought on by stress. The results of
the present study showing the link between poorer health status and problem
gambling confirm these associations in a large representative community
sample and go further by showing this association to be independent of
co-occurring mental disorders or substance abuse. Explanations for this
association focus on the role of stress as a mediating factor (e.g., As noted, we
have identified considerable variation in the prevalence of problem gambling
across Thus, the
data lend modest support to policy options intended to reduce harms
associated with gambling by controlling the expansion of legalized gambling
venues such as casinos and racetracks with slot machines. Our findings are
also consistent with the gaming profile of clients entering treatment for problem
gambling, namely an increase in the proportion of treated cases for whom slot
machine play is the primary problem during a period of rapid increase in
community access to legalized slots (Urbanoski & Rush, 2006).
We did not
confirm a relationship between the availability of treatment for problem
gambling and rates of problem gambling in the community. One might have
expected
Overall, our
findings are important for discussion of intraprovincial needs-based
allocation of prevention and treatment resources for problem gambling. In
this context, the strong association between problem gambling and substance
abuse also confirms the importance of addressing prevention and treatment of
problem gambling in the context of addictive behaviour and disorders
generally. Our use of GIS technology contributed uniquely to our
understanding of regional variations in prevalence by enhancing our ability
to efficiently organize our data along spatial dimensions, to efficiently and
rapidly visualize relationships in several ways, and to interpolate data
across regions. Expanding the data set to incorporate a variety of other
population level indicators associated with substance use and harms may
provide additional insights. The recent reorganization of health services
into Local Integrated Health Networks also provides a new policy-relevant,
geographic structure for organizing and interpreting such data for
decision-makers. Limitations
In addition
to the difficulties in quantifying exposure to gambling opportunities already
mentioned, our findings are constrained in other ways. While CCHS 1.2
provided a large sample, the relatively low prevalence of problem gambling
means that only 244 problem gamblers were identified. This affects the
precision of the regional survey estimates and our ability to identify
statistically significant differences. Our methods also did not include
detailed consideration of neighbourhood-level factors such as local
employment rates, neighbourhood density, and other indicators of community
wellness. Other potentially important missing variables are markers of
culture such as ethnicity and language. These could not be included because
of data limitations or sample size issues. Future research A number of
more sophisticated approaches to the modelling of the spatial relationships
might be applied if their data requirements could be met. The attractive
power of individual gambling or treatment facilities, or of the cities in
which they are located, might usefully be modelled. With a larger sample, it
might also become reasonable to attempt to include known patterns of travel,
such as commuting for work, recreation, or shopping. More precise information
on respondent locations might also make it possible to use detailed
information on road and rail networks to construct measures of accessibility
that would be more meaningful than simple proximity. Another
technique of spatial analysis that might usefully be brought to bear is
spatially weighted regression, which might be used to examine variations in
the effect of risk factors across areas. One candidate for such an analysis
is proximity itself. For example, distance may be a weaker deterrent to
individuals in remote areas who are accustomed to regularly travelling long
distances. Other techniques of cluster scanning might also prove useful,
including "hazard" methods and space/time scans, which take the
timing of cases into account. Finally, if
the availability of casino gambling does affect the prevalence of problem
gambling, differences should be observed at the population level and over
time. If future large and well-designed national health surveys continue to
assess respondents for problem gambling, it will be possible to obtain more
robust estimates and to track changes in prevalence and availability over
time. Such a series of cross-sectional surveys might provide a robust
opportunity to study the impact of changes in both treatment and gambling availability.
References Abbott, M.W., & Volberg, R.A.
(1996). The Adlaf, E.M., & Ialomiteaunu, A.
(2000). Prevalence of problem gambling in adolescents: Findings from the 1999
Ontario Student Drug Use survey. Canadian Journal of Psychiatry, 44,
752–755. American Psychiatric Association.
(1994). Diagnostic and Statistical Manual of Mental Disorders (DSM-IV).
Chaix, B., Cox,
B., Yu, N., Afifi, T., & Ladouceur, R. (2005). A national survey of
gambling problems in Cunningham-Williams, R., Cottler, L.B., Erickson, L., Ferris, J., & Wynne, H. (2001). The
Canadian Problem Gambling Index: Final report. Ferris, J., Wynne, H., & Single, E.
(1998). Measuring problem gambling in Gilliland, J.A., & Ross, N.A.
(2005). Opportunities for video lottery terminal gambling in Gravel, R., & Béland, Y. (2005). The
Canadian Community Health Survey: Mental Health and Well-Being. Canadian
Journal of Psychiatry, 50, 573–579. Kairouz, S., Nadeau, L., & Lo Siou, G.
(2005). Area variations in the prevalence of substance use and gambling
behaviours and problems in Kessler, R.C., & Üstün, T.B. (2004). The World Mental Health (WMH) Survey Initiative Version of the World Health Organization (WHO) Composite International Diagnostic Interview (CIDI). International Journal of Methods in Psychiatric Research, 13, 93–121. Korn, D. (2001). Examining gambling issues from a public health perspective. Electronic Journal of Gambling Issues: eGambling, 4. Retrieved May 2005 from http://www.camh.net/egambling/issue4/feature/index.html
Kulldorff, M. (1997). A spatial scan
statistic. Communications in Statistics: Theory and Methods, 26,
1481–1496. Kulldorff, M., & Information
Management Services, Inc. (2002). SaTScan v.3.0.5: Software for the
spatial and space-time scan statistics. Ladouceur, R. (1996). The prevalence of
pathological gambling in Latkin, C., Glass, G.E., & Lesieur, H.R., & Blume, S.B. (1987).
The South Oaks Gambling Screen (SOGS): A new instrument for the
identification of pathological gamblers. American Journal of Psychiatry,
144, 1184–1188. Mann, R.E., Flam-Zalcman, R., Smart,
R.G., Rush, B.R., & Suurvali, H.C. (2006). Alcohol consumption,
Alcoholics Anonymous membership and suicide mortality rates, Mann, R.E., Smart, R.G., Rush, B.R.,
Flam-Zalcman, R., & Suurvali, H.C. (2005). Cirrhosis mortality in Midford R., Masters L., Phillips M., Daly
A., Stockwell T., Gahegan M., & Philp, A.
(1998). Alcohol consumption and
injury in National
Council of Welfare. (1996). Gambling in National
Research Council (1999). Pathological gambling: A critical review.
Reidpath,
D.D., Burns, C., Garrard, J., Mahoney, M., & Townsend, M. (2002). An
ecological study of the relationship between social and environmental
determinants of obesity. Health & Place, 8, 141-145.
Rush, B.R., Shaw Moxam, R., &
Urbanoski, K. (2002). Characteristics of people seeking help from specialized
programs for the treatment of problem gambling in http://www.camh.net/egambling/issue6/research/
Scherrer, J.F., Xian, H., Shah, K.R.,
Volberg, R., Slutske, W., & Shaffer, H.J., Freed, C., & Healea,
D. (2002). Gambling disorders among homeless persons with substance use
disorders seeking treatment at a community center. Psychiatric Services,
53, 1112–1117. Shaffer, H.J., & Korn, D.A. (2002). Gambling
and related mental disorders: A public health analysis. Annual Review of
Public Health, 23, 171–212. Smart, R.G., & Ferris, J. (1996).
Alcohol, drugs and gambling in the Spunt, B., Dupont, I., Lesieur, H., Statistics Statistics Urbanoski, K., & Rush, B.R. (2006).
Characteristics of people seeking treatment for problem gambling in Volberg, R.A. (1994). The prevalence and
demographics of pathological gamblers: Implications for public health. American
Journal of Public Health, 84, 237–241. Weinstock, J., Blanco, C., & Wiebe, J., Mun, P., & Kauffman, N.
(2006). Gambling and problem gambling in Ontario 2005. Wiebe, J., Single, E., &
Falkowski-Ham, A. (2001). Measuring gambling and problem gambling in
Ontario. Zhu, L., Gorman, D.M., & Horel, S.
(2004). Alcohol outlet density and violence: A geospatial analysis. Alcohol, 39, 369–375. ******* Manuscript history: submitted May 29, 2006; accepted January 23, 2007. This article was peer-reviewed. All URLs were available at the time of submission. For correspondence: Brian Rush, PhD,
Health Systems Research and Consulting Unit, T304, 33 Russell Street,
Toronto, Ontario, Canada, M5S 2S1. Phone: 416-535-8501 ext. 6625, fax: 416-979-4703,
e-mail: brian_rush@camh.net, URL: http://www.camh.net/hsrcu/ Contributors:
BR conceived the study, BR and EA contributed to the study design, and SV conducted
the data cleaning, analysis, and prepared a first draft. All authors were
involved in writing the final draft of the paper. Competing
interests: None declared. Ethics
approval: The Centre for Addiction and Mental Health Research Ethics Board
approved on March 19, 2003, the research project, "Assessing the
geo-spatial association in Ontario between the prevalence of problem
gambling, treatment availability and help seeking" (Protocol Reference
#58/2003). Funding: This
study was supported by a grant from the Ontario Problem Gambling Research
Centre. Brian
Rush (PhD, epidemiology and biostatistics, University of Western Ontario,
1987) is a senior scientist with the Centre for Addiction and Mental Health
and is currently the associate director of the Health Systems Research and
Consulting Unit within the Centre and an associate professor in the
Departments of Psychiatry and Public Health Sciences at the Scott
Veldhuizen is a research analyst with the Health Systems Research and
Consulting Unit at the Centre for Addiction and Mental Health (CAMH) and a
graduate of the Edward
Adlaf, PhD, is a research scientist and co-head of the Public Health and
Regulatory Policy Unit at the Centre for Addiction and Mental Health. Ed
holds an appointment as associate professor in the Departments of Public
Health Sciences and Psychiatry, Faculty of Medicine,
|
||||||||
|
|
issue 20 — june 2007  |
contents | submissions | links | archive | subscribe
Please note that these links will always point to the current issue of JGI. To navigate previous issues, use the sidebar links near the top of the page.
Copyright © 1999-2007 The Centre for Addiction and Mental Health
Editorial Contact: Phil Lange
Join our list to be notified of new issues. Subscribe