| |
|||||||||||||||||
|
|
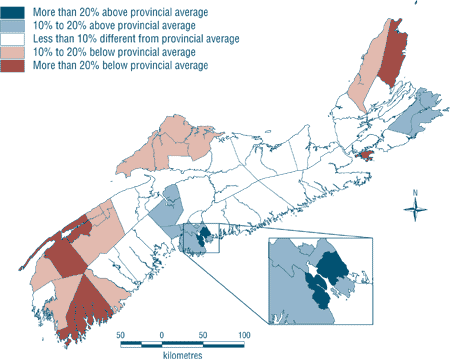
Geographic variation in health services use in Nova Scotia Abstract To further our understanding of factors underlying geographic variation in health and the potential role of availability of and access to health services, we sought to quantify the geographic variation in health services use in the province of Nova Scotia. For the period 1996 to 1999 we examined the variation in the use of health services across 64 geographic areas in conjunction with health and socio-economic factors, using multilevel methods and empirical Bayesian estimates based on provincial physician billings and hospital separation records. We revealed moderate geographic variation in the use of family physician services and large variation in specialist and hospital services. In the two urban centres, Metropolitan Halifax and the Cape Breton Regional Municipality, use of specialist services was respectively 26.24% and 15.59% higher than the provincial average, and use of hospital services was respectively 21.55% and 37.67% higher. Geographic areas in which residents had better health were characterized by more use of family physician services and reduced use of specialist and hospital services. These associations seem to support policy strategies that aim to improve health and to reduce health care costs by investing in prevention and primary health care, and they highlight the potential implications of the shortage of family physicians across Canada. Key words: compression of morbidity; health policy; health services accessibility; life expectancy; medically underserved area; multilevel analysis; socio-economic factors Introduction Nova Scotia shows geographic variation in the health status of its residents, as evidenced by differences in local life expectancy and primary underlying causes of death in communities across the province.1 This variation in health may result from differences in age, socio-economic status, lifestyle behaviours such as smoking and diet, and the delivery of appropriate preventive and curative health services.2-8 Universal health care coverage has been implemented to ensure delivery of services on the basis of need rather than ability to pay and, in so doing, implicitly recognizes individuals' differential need for health care based on differences in their health status. While differential need for care would be expected to drive differential use of such care, remaining inequities in availability and access to appropriate health services may also contribute to disparities in health and even further augment existing inequities.8 A socio-economic gradient in health, whereby wealthier, more highly educated individuals and groups experience better health has been widely demonstrated. It has also been shown that, even where health care coverage exists, there are socio-economic disparities in the amount and type of health care used.6,8,9-11 For example, socio-economically disadvantaged individuals are more likely to use emergency room services for conditions that could be addressed by a primary care physician during regular office hours.10,12 People of higher socio-economic status use specialist physician services disproportionately to their need, demonstrating a possible referral bias by primary care physicians or such patients' ability to better negotiate the health care system.6,11 Clearly, differential access to and differential availability of health services may affect the health of individuals and contribute to geographic variation in health. In order to further our understanding of factors underlying geographic variation in health and the potential role of availability of and access to health services, we sought to quantify the geographic variation in health services use in Nova Scotia. Methods Geographic definitions and measures Nova Scotia comprises approximately 940,000 residents, 9 district health authorities, 18 counties, 52 census consolidated subdivisions, 110 census subdivisions, 1,511 federal enumeration areas and 18,864 postal codes. Census subdivisions comprise cities, towns, villages, municipal districts and subdivisions of counties.13 A census consolidated subdivision is a grouping of census subdivisions in which the smaller, more urban census subdivisions (towns, villages, etc.) are combined with the surrounding, larger, more rural census subdivision (municipal districts and subdivisions of counties).13 Aggregation of information at the level of census consolidated subdivision is functional, as rural residents often use services and mailboxes with postal codes in nearby communities and thus researchers will introduce misclassification when using geographic units smaller than census consolidated subdivisions.14 A census consolidated subdivision is also a functional grouping to local policy makers and community health boards, which often operate on a similar geographic scale. For these reasons, we use the census consolidated subdivision as our unit of comparison in non-urban areas. The two urban areas, Metropolitan Halifax and Cape Breton Regional Municipality, are subdivided into areas not exceeding 50,000 residents. Metropolitan Halifax was subdivided by grouping enumeration areas into 11 neighbourhoods, and the Cape Breton Regional Municipality was subdivided by grouping enumeration areas into four areas largely divided by natural borders (lakes and rivers). This brings the number of customized areas to a total of 64 with populations ranging from approximately 2,500 to 41,000 (see Appendix). Information on health care use from 1996 to 1999 was obtained through residential postal codes of provincial administrative physician claims and hospital discharge records and was linked, on the basis of residents' postal codes, to the 64 areas. We considered all recorded physician billings, with a maximum of one per day, to estimate the number of visits to family physicians and specialists. For hospital use, we considered only inpatient hospitalizations, excluding day surgeries. We used life expectancy as a measure of local health status. Life expectancy for residents in each of the 64 geographic areas was averaged over the years 1995 to 1999 and calculated from mortality data in the provincial Vital Statistics registry and population estimates based on the Census, Statistics Canada's online statistical database (CANSIM), and Nova Scotia's Medical Services Insurance registration file (see Appendix). Average household income for each of the 64 geographic areas was calculated according to enumeration area estimates from the 1996 Canada Census.1,8,15 For each of the 64 areas, using multilevel methods, we generated empirical Bayesian estimates for life expectancy and health care use to overcome over-dispersion, the phenomenon of unstable small area estimates resulting from varying population sizes. This methodology is described in detail elsewhere.1 Statistical approaches We depict geographic variation of health services use by means of geographic maps of the age- and sex-standardized mean number of family physician visits, specialist visits, and days in hospital, all expressed as percentage deviation from the provincial average. We further examined possible regional and urban-rural differences by using multilevel regression methods and by considering the 64 areas as co-variates (level 1) nested within regions (level 2). These regions were as follows: non-metropolitan mainland (rural), metropolitan Halifax (urban), non-metropolitan Cape Breton Island (rural) and Cape Breton Regional Municipality (urban). Next we considered the potential modulating effect of area level (level 1) confounders in the multilevel analysis of regional and urban-rural difference in health services use. In this regard, we considered both area level life expectancy and household income, as both have been demonstrated to determine health services use.7,8 Also, both have been demonstrated to vary substantially across the 64 geographic areas,1 area level estimates of life expectancy ranging from 76.34 years to 81.21 years (see Appendix) and average annual household income ranging from $29,112 to $60,496. In the present analyses, life expectancy was expressed as years of deviation from the provincial average and household income as increments of $10,000. All analyses were weighted by geographic population size and conducted using SAS Release 8.02 and HLM5 statistical software packages. Results The average number of visits to family physicians between 1996 and 1999 equaled 3.83 visits and ranged from 3.12 to 4.48 visits (see Appendix). Figure 1 depicts the geographic distribution of the age- and sex-standardized number of family physician visits; areas with the lowest levels of family physician use are depicted in dark red, and those with the highest levels of use are depicted in dark blue. The age- and sex-standardized variation ranged from 18.71% below to 16.91% above the provincial average. While Figure 1 illustrates the moderate variation in the volume of family physician visits, there are no clear regional or urban-rural differences (Table 1). When region, geographic life expectancy and household income were considered simultaneously, there was a 1.08% increase (statistically significant, p value of 0.04) in family physician use with each year of increase in local life expectancy, and a 0.52% decrease (not statistically significant) with each $10,000 increase in household income (Table 1). FIGURE 1
TABLE 1
a p: probability that the estimated
regional differences and associations with life expectancy and household
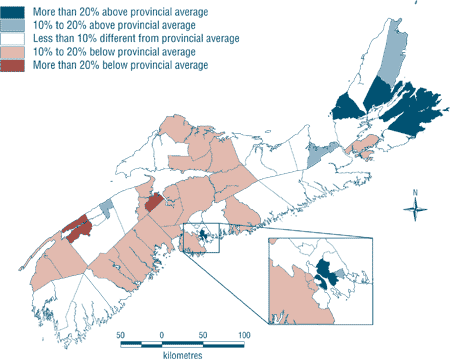
income equal zero Figure 2 is a map depicting the distribution of specialist visits. There is a clear pattern of higher use in and near the urban centres of Halifax and Cape Breton Regional Municipality (blue) and reduced use in rural areas (red). The provincial average number of specialist visits was 1.16 per person annually, and the variation was larger than that of family physician visits, ranging from averages of 0.83 to 1.52 for each of the areas (see Appendix). After standardization for age and sex, the range was from 28.20% below to 31.27% above the provincial average. The large geographic variation was also reflected in large urban-rural differences (Table 2). There was a substantial and statistically significant (p value of 0.04) decrease in local use of specialist services with higher life expectancy (a 2.30% drop for each year of increase) and a positive, but weak, relation between local use and income. FIGURE 2
TABLE 2
a p: probability that the estimated
regional differences and associations with life expectancy and household
income equal zero The map in Figure 3 presents the distribution of hospital services use. Similar to the pattern of specialist services use, more days were spent in hospital by residents of Halifax and Cape Breton Regional Municipality as well as much of Cape Breton Island (blue), and fewer hospital days by residents in rural areas (red). Hospital use averaged 0.22 days per person annually, ranging from 0.16 to 0.35 (see Appendix). After standardization for age and sex, this large variation ranged from 27.58% below to 57.94% above the provincial average. The large variation was also reflected in large urban-rural differences (Table 3). There was a significant negative association between local life expectancy and hospital use (a 5.14% drop for each year of increase) and a non-significant negative relation between income and hospital use. This association between life expectancy and hospital use was not substantially different from the one presented in Table 3 if the confounding effect of household income was not controlled for. Similarly, the associations of life expectancy with family physician and with specialist services use were not substantially different when household income was not considered as a confounder. FIGURE 3
TABLE 3
a p: probability that the estimated
regional differences and associations with life expectancy and household
income equal zero Discussion This study of the geographic distribution in health services use across Nova Scotia revealed moderate, non-systematic variation in family physician services use and large geographic variation and urban-rural differences in specialist and hospital services use. The use of specialist and hospital services was higher among residents of Metropolitan Halifax and the Cape Breton Regional Municipality, the two sites of the province's tertiary care facilities, which offer the full gamut of specialized health services. This volume of use was progressively reduced among residents of rural areas at an increasing distance from the tertiary care facilities. While the existence of this gradient is consistent with that observed in various other studies, we are not aware of other studies that have depicted this gradient by means of small area comparisons and on a population-based scale, making it difficult to conclude how the variation within Nova Scotia relates to that of other jurisdictions. Nevertheless, because the observed inequities are of such high magnitude, i.e. 26% more use of specialist services in Metropolitan Halifax and 38% more use of hospital days in the Cape Breton Regional Municipality, they should receive appropriate priority among health policy makers and be the subject of further investigation. Family physician services, in contrast, are provided throughout the province, and the variation in their use appeared to be of a lesser magnitude and was without a clear geographic gradient. Geographic areas with better health (higher life expectancy) among residents were characterized by more use of primary care physician services and reduced use of specialist and hospital services. Compression of morbidity, the phenomenon whereby prevention and risk reduction reduce individuals' disease burden,16,17 may be acting at the community level as well: residents of areas with higher expenses for preventive and primary care services seem to experience better health, and they incur fewer expenses for specialist and hospital services. These observations also support policy strategies that aim to improve health and reduce health care costs by investing in prevention and primary health care, as was recently proposed in the report of the Romanow Commission on the Future of Health Care in Canada.18 The observations further underline the importance of the shortage of primary care practitioners across Canada,19-20 potentially resulting in fewer visits relative to need and consequently increasing future expenses in terms of specialist and hospital services. In fact, this may be of particular importance to other provinces, since Nova Scotia has a more equitable distribution of primary care practitioners, in that 94% of adults report access to a regular family physician, in contrast, for example, to 76% in Quebec.21 The present study demonstrates large urban-rural differences in the use of specialist and hospital services and no systematic urban-rural gradient in the use of family physician services. These findings, to some extent, may be the result of geographic differences in physician practice patterns. For example, the vast majority of inpatients at the tertiary care facilities in Halifax are admitted under the care of specialists, and admitting privileges for family physicians are limited to one family medicine teaching unit and primary care obstetric cases. In contrast, in many of Nova Scotia's rural community hospitals, patients are admitted under the care of their family physicians, and specialist care is provided on a consultation basis. The extent to which differences in practice patterns and access to health services affect the health of individuals should receive research priority. We previously reported that socio-economically advantaged individuals use relatively more specialist services.8 We confirmed this finding in the present comparison of geographic areas (Table 2). This association, however, strongly diminished when local life expectancy was simultaneously considered, indicating that need for health services is better characterized by local health than by local socio-economic conditions. While none of the adjusted associations between socio-economic conditions and health services use was statistically significant, they are in keeping with findings by others: that individuals and groups of higher socio-economic status use relatively fewer family physicians and hospital services.6,8,11,12,22-26 Conversely, wealthier and better-educated individuals and groups tend to make more frequent use of specialist care relative to their need. This may be because of a higher referral rate by primary care physicians in combination with the patients' better ability to recognize their need and then ask for such services.6,8,11 This study is a continuation of work previously reported in Chronic Diseases in Canada,1 in which we developed appropriate methods, such as the definition of areas that are relevant to local health policy makers and the handling of over-dispersion in small area comparisons. The previous and current studies included ecological comparisons and have consequent limitations. Previously, we reported how selective migration to nursing homes may affect geographic comparisons of health. They may similarly affect geographic comparisons of health services use, although they are unlikely to account for the large differences in specialist and hospital services. In addition, in ecological comparisons, we should also be cautious about causal directions. For example, the positive association between family physician visits and the health of communities is interpreted as a result of participation in more preventive and primary care. However, one should also consider that residents of healthier communities are relatively released from the stress of engaging in curative care and may therefore more actively seek preventive care. Such quandaries cannot be addressed in ecological studies and require further research to reveal the exact nature of the relationships. Likewise, more knowledge can be gained from small area comparisons focusing on specific services and health outcomes. In this respect, small area comparisons provide new opportunities and, if considered as an integrated part of health policy, should receive increased investment to improve the quantity and quality of geographic information. In summary, we described the geographic distribution in health services use across Nova Scotia and revealed moderate, non-systematic variation in family physician services use and large geographic variation and urban-rural differences in specialist and hospital services use. Healthy areas were characterized by higher use of family physician services and reduced use of specialist and hospital services. Acknowledgements This research was supported by funding from the Canada Foundation for Innovation and the Nova Scotia Health Research Foundation, and through a Canadian Institutes of Health Research Career Award to Dr. Veugelers. Although some of the data analyzed were provided by the Nova Scotia Department of Health to the Population Health Research Unit, Dalhousie University, the conclusions are solely those of the authors. References
Author References Paul J Veugelers and Alexandra M Yip, Department of Community Health and Epidemiology, Faculty of Medicine, Dalhousie University, Halifax, Nova Scotia, Canada David C Elliott, Performance Monitoring and Evaluation, Nova Scotia Department of Health Correspondence: Paul J Veugelers, Department of Community Health and Epidemiology, Faculty of Medicine, Dalhousie University, 5790 University Ave, Halifax, Nova Scotia, Canada B3H 1V7; Fax: (902) 494-1597; E-mail: Paul.Veugelers@dal.ca |
||||||||||||||||||||||||||||||||||||||||||||||||||||||||||||||||||||||||||||||||||||||||||||||||||||||||||||||||||||||||||||||||||||||||||||||||||||||||||||||||||||||||||||||||||||||||||||||||||||||||||||||||||||||||||||||||||||||||||||||||||||||||||||||||||||||||||||||||||||||||||||||||||||||||||||||||||||||||||||||||||||||||||||||||||||||||||||||||||||||||||||||||||||||||||||||||||||||||||||||||||||||||||||||||||||||||||||||||||||||||||||||||||||||||||||||||||||||||||||||||||||||||||||||||||||||||||||||||||||||||||||||||||||||||||||||||||||||||||||||||||||||||||||||||||||||||||
| APPENDIX
Regional abbreviations: NMM, non-metropolitan mainland; MH, metropolitan Halifax; NMCBI, non-metropolitan Cape Breton Island; CBRM, Cape Breton Regional Municipality. Population: average population size calculated as previously described. (1) Life expectancy: empirical Bayesian estimates calculated as previously described. (1) |
|||||||||||||||||||||||||||||||||||||||||||||||||||||||||||||||||||||||||||||||||||||||||||||||||||||||||||||||||||||||||||||||||||||||||||||||||||||||||||||||||||||||||||||||||||||||||||||||||||||||||||||||||||||||||||||||||||||||||||||||||||||||||||||||||||||||||||||||||||||||||||||||||||||||||||||||||||||||||||||||||||||||||||||||||||||||||||||||||||||||||||||||||||||||||||||||||||||||||||||||||||||||||||||||||||||||||||||||||||||||||||||||||||||||||||||||||||||||||||||||||||||||||||||||||||||||||||||||||||||||||||||||||||||||||||||||||||||||||||||||||||||||||||||||||||||||||||
|
[Previous] [Table of Contents] [Next]
|
|||||||||||||||||||||||||||||||||||||||||||||||||||||||||||||||||||||||||||||||||||||||||||||||||||||||||||||||||||||||||||||||||||||||||||||||||||||||||||||||||||||||||||||||||||||||||||||||||||||||||||||||||||||||||||||||||||||||||||||||||||||||||||||||||||||||||||||||||||||||||||||||||||||||||||||||||||||||||||||||||||||||||||||||||||||||||||||||||||||||||||||||||||||||||||||||||||||||||||||||||||||||||||||||||||||||||||||||||||||||||||||||||||||||||||||||||||||||||||||||||||||||||||||||||||||||||||||||||||||||||||||||||||||||||||||||||||||||||||||||||||||||||||||||||||||||||||
|
|
|||||||||||||||||||||||||||||||||||||||||||||||||||||||||||||||||||||||||||||||||||||||||||||||||||||||||||||||||||||||||||||||||||||||||||||||||||||||||||||||||||||||||||||||||||||||||||||||||||||||||||||||||||||||||||||||||||||||||||||||||||||||||||||||||||||||||||||||||||||||||||||||||||||||||||||||||||||||||||||||||||||||||||||||||||||||||||||||||||||||||||||||||||||||||||||||||||||||||||||||||||||||||||||||||||||||||||||||||||||||||||||||||||||||||||||||||||||||||||||||||||||||||||||||||||||||||||||||||||||||||||||||||||||||||||||||||||||||||||||||||||||||||||||||||||||||||||
| Last Updated: 2004-01-09 | |||