Eighty-five percent of the electors surveyed were aware of the federal by-election that took place on March 4, 2024, in their riding.
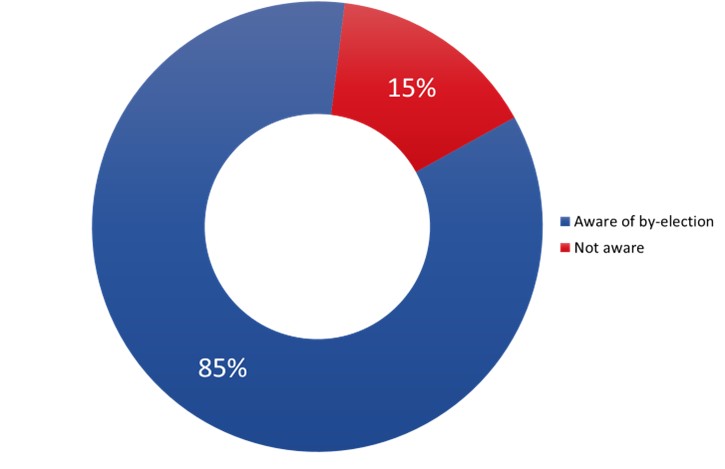
Q6. Did you know that a federal by-election took place on March 4, 2024, in your riding? Base: n=402, all respondents.
This pie chart shows the breakdown of respondents who were aware of the Durham by-election. 85 percent said they were aware of the by-election while 15 percent said they were not aware.
Awareness of the by-election was lower among:
Nearly two thirds (64%) of respondents knew that electors can register at the polling place on election day and then vote immediately. Fewer, but still a majority at 57%, were aware that electors can check, update or complete their voter registration on Elections Canada's website. The rest were more likely to report not knowing whether either is possible than to say definitively that neither is possible.
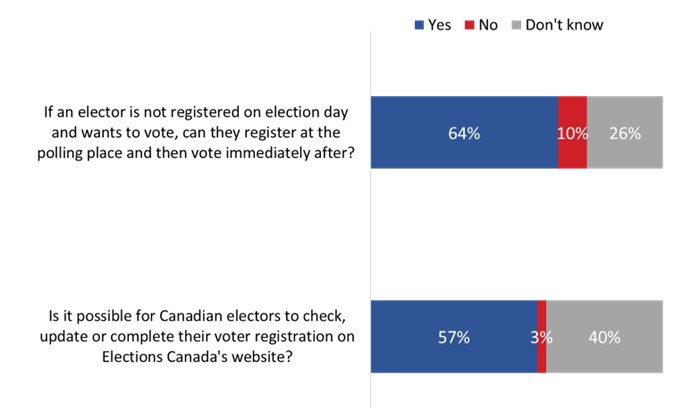
Q7. If an elector is not registered on election day and wants to vote, can they register at the polling place and then vote immediately after? / Q8. Is it possible for Canadian electors to check, update or complete their voter registration on Elections Canada's website? Base: n=402, all respondents.
This stacked horizontal bar chart shows the breakdown of respondents who knew about voting registration. When asked if you can register at a polling place 64 percent said yes, 10 percent said no and 26 percent did not know. When asked if you can update your voting registration online 57 percent said yes, 3 percent said no and 40 percent did not know.
Awareness that electors can register and then immediately vote at a polling place on election day was higher among electors aged 35 to 54 (72%, compared to 55% of those aged 18 to 34) and university graduates (72%, compared to 52% of those who completed high school or less).
Electors aged 18 to 34 (68%) were more likely to know that it is possible to check, update or complete their voter registration on Elections Canada's website compared to those aged 35 to 54 (54%) and those aged 55+ (51%).
Virtually all electors (97%) correctly responded that proof of identity is required to vote in a Canadian federal election. Nine in 10 electors (90%) were aware that a proof of address is also required to vote.

Q. In order to vote in a Canadian federal election, do voters have to present ... Q9) A proof of IDENTITY? Q10) A proof of ADDRESS? Base: n=402, all respondents. [Q9 No: 2%/Don't know: 2%; Q10 No: 3%/Don't know: 6%].
This stacked horizontal bar chart shows the breakdown of respondents who knew what documents they needed in order to vote. When asked if voters needed to present ID to vote 97 percent said yes, with very few saying no or don't know. When asked if voters needed to present proof of address 90 percent said yes, with very few saying no or don't know.
Men were less likely than women to know that proof of identity is needed to vote (95%, compared to 99% of women), and electors with a disability were less likely than other electors to be aware that a proof of address is needed to vote (81%, compared to 92% of electors without a disability).
Respondents were asked to identify the current ways that electors can vote in a federal election. The vast majority (87%) identified voting in person at a polling station on election day, followed by voting at advance polls in person (60%) and voting by mail (47%). One in five electors (19%) had the impression that it is possible to vote online. (Note: It is currently not possible to vote online, on the telephone, by computer or electronically in a federal election.) All other responses were mentioned by smaller proportions, as indicated in Figure 4.

Q11. To the best of your knowledge, what are the current ways that electors can vote in a federal election? Base: n=399, all respondents who completed the survey by telephone.
This horizontal bar chart shows the percentage of respondents who knew they could vote at an advance polling station, at the local Elections Canada office, and by mail. The breakdown is as follows: 87 percent said in person at a polling station on election day, 60 percent said at advance polls, in person, 47 percent said by mail, 19 percent said online (non-specific), 2 percent said on the telephone, 1 percent said at a local EC office / office of the returning officer, 1 percent said special ballot, write-in ballot, absentee ballot, 1 percent said at home, 1 percent said proxy, 6 percent said other and 5 percent said they did not know.
Notable subgroup differences include the following:
Most electors (84%) who were aware of the federal by-election (n=344) said they received a voter information card (VIC) during the election campaign, addressed to them personally, which provided information about where and when to vote.
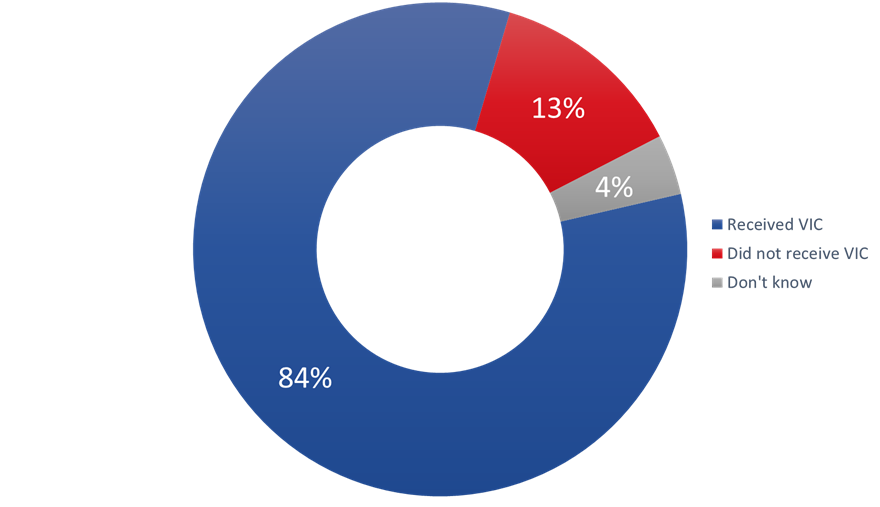
Q12. During the campaign, did you receive a voter information card addressed to you personally and telling you where and when to vote? Base: n=344, those aware of the by-election.
This pie chart shows the breakdown of respondents who received a voter information card. 84 percent said they received their voter information card. 13 percent said they did not. 4 percent did not know whether they did or not.
The likelihood of reporting that they received their VIC was higher among those 55 and older (88%) compared to those 18 to 34 (74%).
Approximately two thirds (65%) of electors who were aware of the by-election saw or heard advertising from Elections Canada about where, when and how to vote on at least one medium or format. Specifically, 28% recalled hearing advertising from EC on the radio or an audio platform, 25% recalled advertising on social media and 23% when browsing websites or on a mobile application. Roughly one in 10 (11%) recalled seeing advertising from EC in a local newspaper.
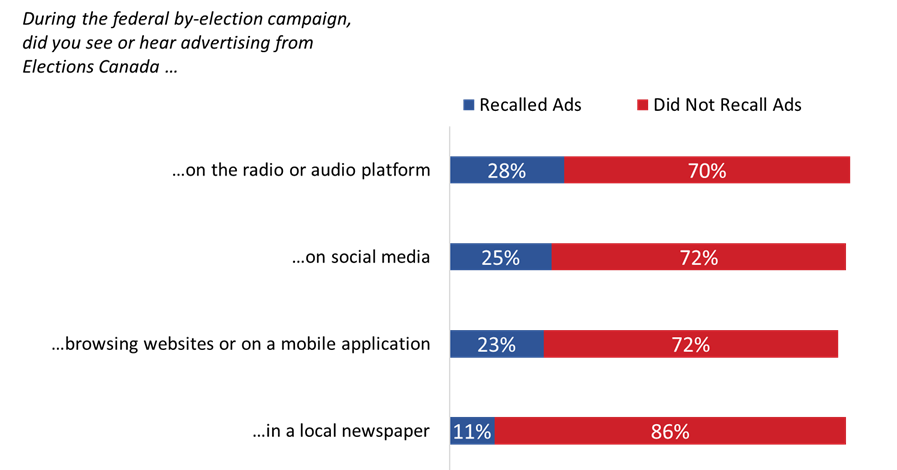
Q14–17. During the federal by-election campaign, did you see or hear advertising from Elections Canada about where, when and how to vote … Base: n=344, those aware of the by-election. [Don’t know: 3% to 5%].
This horizontal bar chart shows the comparison of respondents who recalled ads versus those who did not. When asked if they heard ads on the radio or an audio platform 28 percent said they had while 70 percent had not. When asked if they saw ads on social media 25 percent said they had while 72 percent had not. When asked if they saw ads on websites or mobile applications 23 percent said they had while 72 percent said they had not.
Electors aged 35 to 54 were more likely to have heard ads from EC on the radio or an audio platform (36%, compared to 16% of those aged 18 to 34), and those aged 55 and older were the most likely to have seen ads in a local newspaper (17%, compared to 2% of 18-to-34-year-olds and 9% of 35-to-54-year-olds).
One quarter (24%) of electors who were aware of the by-election said they recalled seeing or hearing advertisements from EC in other formats, including outdoor signage (8%), other print (5%) and television (5%). For a full list, see Figure 7 footnote 1.
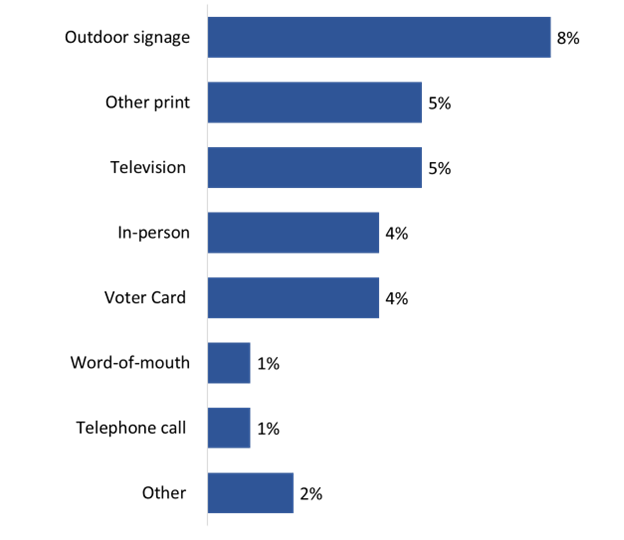
Q18. During the by-election campaign, did you see or hear advertising from Elections Canada about where, when and how to vote in any other format? Base: n=344, those aware of the by-election. [Don’t know: 1%].
This horizontal bar graph shows the breakdown of responses for those who said they saw or heard other formats of ads. 8 percent saw outdoor signage, 5 percent saw print ads, 5 percent saw television ads, 4 percent saw in-person ads, 4 percent saw voter cards, 1 percent heard through word of mouth, 1 percent heard from telephone calls and 2 percent saw or heard other sources.
Most electors (83%) who were aware of the by-election felt informed about when, where and how they could vote, with 71% saying they felt very informed and 12% saying they felt somewhat informed.
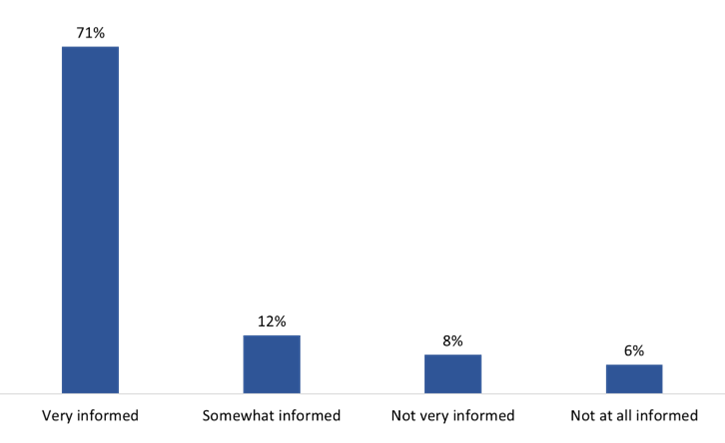
Q13. Overall, how well informed do you feel you were about when, where and how to vote in the by-election? Base: n=344, those aware of the by-election. [Don't know: 2%/Prefer not to say: <1%].
This vertical bar chart shows the breakdown of how informed respondents felt about when and how to vote in the by-election. 71 percent said they felt very informed about how, when and where to vote. 12 percent felt somewhat informed, 8 percent felt not very informed and 6 percent felt not at all informed.
Those aged 55 and older were more likely to be very informed (78%, compared to 62% of those aged 18 to 34 years).
To make sure they were registered to vote in this federal by-election, 15% of those who were aware of the by-election checked to confirm their registration, 3% updated their registration information and 2% had recently registered to vote. The majority (77%) took no action to make sure they were registered to vote in this federal by-election.

Q19. What, if anything, did you do to make sure you were registered to vote in this federal by-election? Did you …? Base: n=344, those aware of the by-election. [Don’t know: 2%/Prefer not to say: 1%].
This horizontal bar chart shows which action respondents took to make sure electors were registered to vote. 2 percent had recently registered to vote, 3 percent had updated their information, 15 percent checked that they were already registered and 77 percent performed no actions.
Among those who did something to make sure they were registered to vote in this federal by election (n=69), 25% made sure their VIC was correct, 19% contacted Elections Canada through the website and 18% used EC's Online Voter Registration System. The full range of actions can be found in Figure 10.
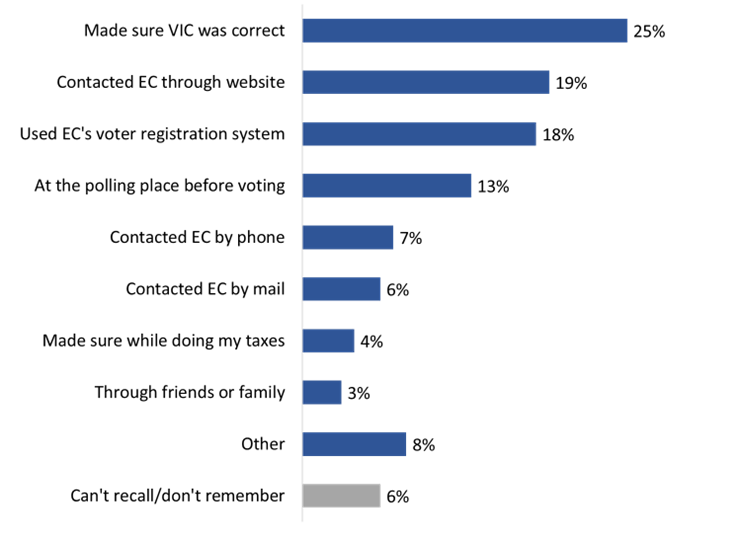
Q20. How did you make sure you were registered? Base: n=66, took action to confirm registration status.
This horizontal bar chart shows how respondents made sure they were registered to vote. 25 percent said they made sure their VIC was correct, 19 percent contacted EC through the website, 18 percent used EC's voter registration system, 13 percent checked at their polling place before voting, 7 percent contacted EC by phone, 6 percent contacted EC by mail, 4 percent made sure while doing their taxes, 3 percent made sure through friends and family, 8 percent said other and 6 percent could not recall or did not remember.
Two thirds of electors (67%) said they voted in the federal by-election held in their riding, with another one in five (18%) saying they usually vote but did not do so for this election and one in 10 (10%) saying they simply did not vote in this by-election.
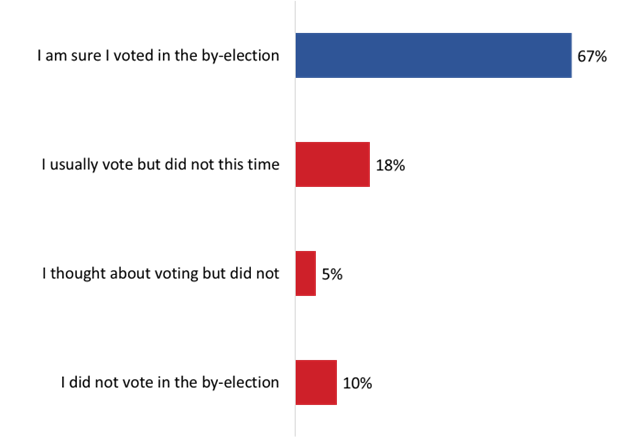
Q21. Many people don’t or can’t vote for a variety of reasons. Which of the following statements describes you? Base: n=344, those aware of the by-election.
This horizontal bar chart shows the percentage of respondents who voted in the Durham election. 67 percent said they voted in the by-election, 18 percent said they usually vote but did not this time, 5 percent said they thought about voting but did not and 10 percent said they did not vote in the by election.
Those aged 55+ were more likely to say they voted (78%) compared with 51% of 18-to-34-year-olds and 66% of 35-to-54-year-olds.
Of those electors who said they did not vote (n=104), the primary reasons for not doing so were everyday life or health reasons (39%) and political reasons (33%). Just over one in 10 (13%) did not vote for reasons related to the electoral process. Other reasons mainly included forgetting to vote (7%).
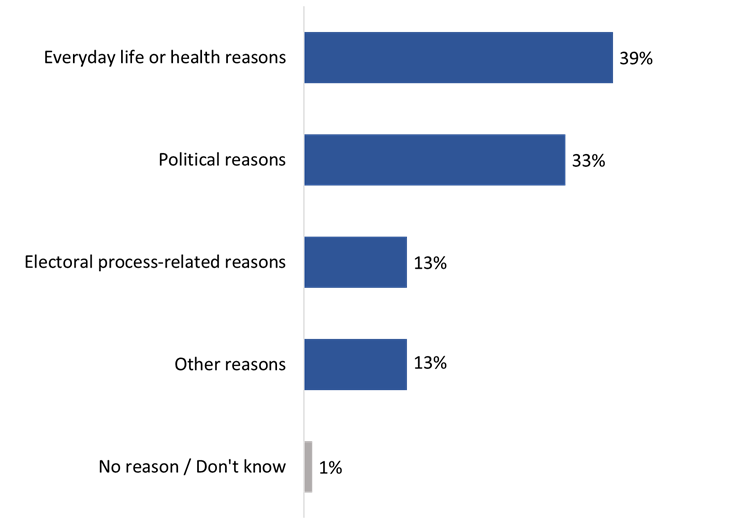
Q22. What is the main reason you did not vote? Base: n=104, those who did not vote.
This horizontal bar chart shows the breakdown of the reasons given by those who did not vote. 39 percent said they did not vote because of everyday life or health reasons, 33 percent said they did not vote because of political reasons, 13 percent because of electoral process–related reasons, 13 percent for other reasons, and 1 percent said they did not have a reason or did not know.
The table below provides a detailed breakdown of the reasons why surveyed electors did not vote during the March 4, 2024, federal by-election.
| Reasons for Not Voting | Percentage |
|---|---|
| Everyday life or health reasons | 39% |
| Too busy | 21% |
| Out of town | 13% |
| Illness or disability | 5% |
| Political reasons | 33% |
| Lack of information about campaign issues and parties' positions | 12% |
| Did not like candidates/parties/campaign | 6% |
| Felt voting would not make a difference | 4% |
| Not interested in politics | 4% |
| Did not know whom to vote for | 4% |
| Do not trust politicians/politics | 3% |
| Electoral process–related reasons | 13% |
| Lack of information about voting process (e.g. when/where to vote) | 10% |
| Issues with VIC and identification (e.g. could not prove identity) | 2% |
| Not on voters list | 2% |
| Other reasons | 13% |
| Forgot to vote | 7% |
| Other reasons | 6% |
| Don't know/No reason | 2% |
Among electors who did not vote because they were too busy (n=16), half said they had other priorities that day. In addition, a small number of electors had something come up that required them to change their plans or felt they do not have time in their normal schedule to vote.
More electors who were out of town during the by-election (n=14) were away from home for personal reasons rather than work. Their travel was more likely to be planned than unplanned.
Of the electors who voted (n=239), nearly two thirds (63%) said they voted on election day at a polling station, while just over one third (35%) said they voted at an advance polling station. Very few reported voting by mail or at a local EC office.

Q26. Which method did you use to vote? Was it ... Base: n=239, those who voted. [Don’t know: 1%].
This horizontal bar chart shows the breakdown of the methods respondents used to vote. 63 percent voted at a polling station on election day, 35 percent used advance polling stations, 1 percent voted by mail and less than 1 percent used their local Elections Canada office to vote.
Notable subgroup differences include the following:
One quarter (25%) of those who said they voted in personfootnote 2 (n=236) reported doing so in the morning between 8:00 a.m. and noon. The rest were fairly evenly split between voting in the afternoon between noon and 4:00 p.m. (34%) and in the evening between 4:00 p.m. and the close of polls (36%).
Of the voters who voted on election day (n=151), more reported voting between 4:00 p.m. and the close of polls (41%) than in the morning (24%) or afternoon (29%), with the single largest proportions doing so between noon and 1:00 p.m. (12%) or between 5:00 and 6:00 p.m. (14%).
Of the voters who voted at an advance polling station (n=84), approximately four in 10 (42%) voted in the afternoon between noon and 4:00 p.m. Among the rest, just over one quarter each voted in the morning (27%) or the evening (27%).
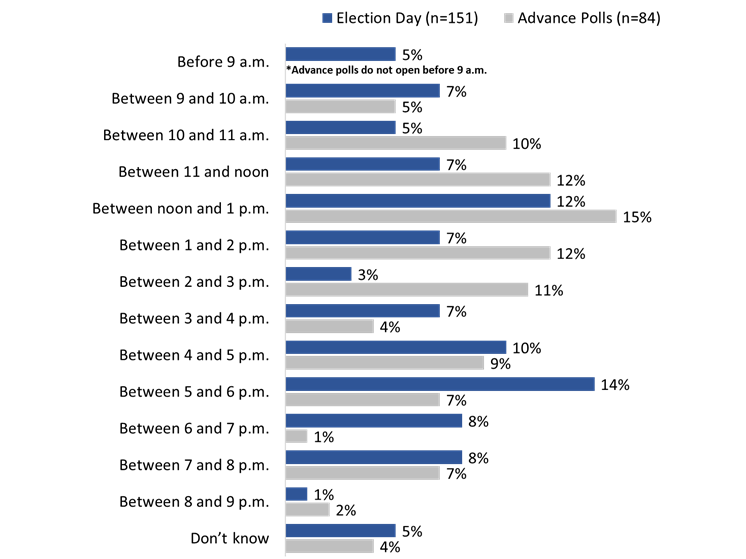
Q27. Do you remember approximately what time it was when you went to vote at the [polling station/advance polling station/local Elections Canada office]? Base for the graph: respondents who voted in person on election day or at an advance poll.
This double horizontal bar chart shows the comparison of those who voted on election day and those who used the advance polls, based on time of day. 5 percent of election day voters voted before 9am although advance polls had yet to open. 7 percent of election day voters voted from 9am to 10am compared to 5 percent of advance poll voters. 5 percent of election day voters voted from 10am to 11am compared to 10 percent of advance poll voters. 7 percent of election day voters voted from 11am to noon compared to 12 percent of advance poll voters. 12 percent of election day voters voted from noon to 1pm compared to 15 percent of advance poll voters. 7 percent of election day voters voted from 1pm to 2pm compared to 12 percent of advance poll voters. 3 percent of election day voters voted from 2pm to 3pm compared to 11 percent of advance poll voters. 7 percent of election day voters voted from 3pm to 4pm compared to 4 percent of advance poll voters. 10 percent of election day voters voted from 4pm to 5pm compared to 9 percent of advance poll voters. 14 percent of election day voters voted from 5pm to 6pm compared to 7 percent of advance poll voters. 8 percent of election day voters voted from 6pm to 7pm compared to 1 percent of advance poll voters. 8 percent of election day voters voted from 7pm to 8pm compared to 7 percent of advance poll voters. 1 percent of election day voters voted from 8pm to 9pm compared to 2 percent of advance poll voters. 5 percent of election day voters who voted did not know what time they voted compared to 4 percent of advance poll voters.
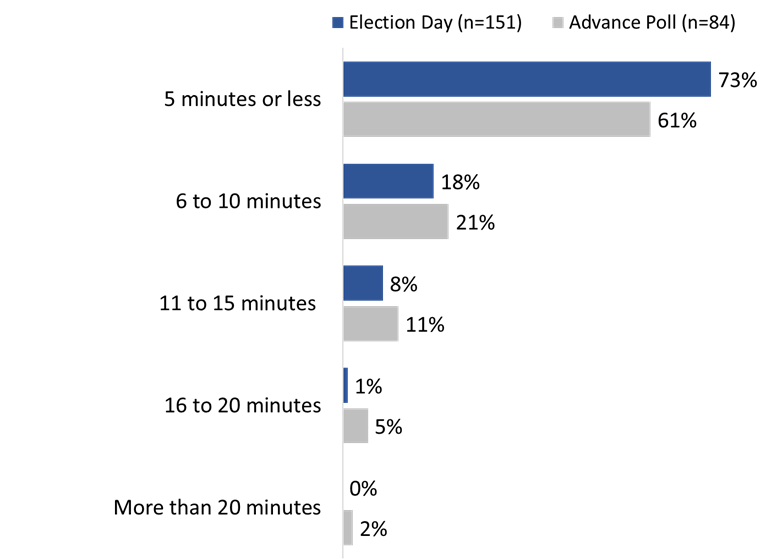
Among those who voted in person (n=236), six in 10 (61%) said it took five minutes or less to travel to the polling place, while nearly three in 10 (28%) said it took between six and 10 minutes. One in 10 (12%) reported that it took more than 10 minutes for them to travel to the polling place.
Figure 16 presents reported travel time, broken out by voting place. Those who voted at a polling station on election day (69%) were more likely than those who voted at an advance polling station (45%) to say it took them five minutes or less to travel to the polling place. In contrast, those who voted at an advance poll (39%) were more likely than those who voted on election day (22%) to say it took six to 10 minutes to travel to the polling place.
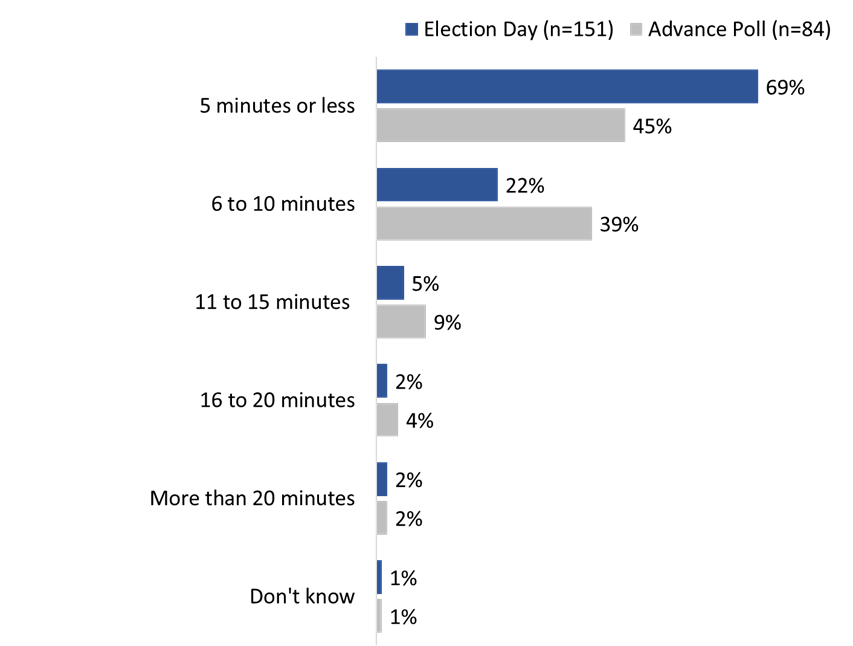
Q28. To the best of your knowledge, how long did it take you to travel to the [polling station/advance polling station/local Elections Canada office]? Base for the graph: respondents who voted in person on election day or at an advance poll.
This double horizontal bar chart shows the comparison of those who voted on election day and those who used advance polling based on how long it took to travel to the poll. 69 percent of those who voted on election day said it took five minutes or less compared to 45 percent of those who voted at an advance poll. 22 percent of those who voted on election day said it took six to 10 minutes to travel compared to 39 percent of those who voted at an advance poll. 5 percent of those who voted on election day said it took 11 to 15 minutes to travel compared to 9 percent of those who voted at an advance poll. 2 percent of those who voted on election day said it took 16 to 20 minutes to travel compared to 4 percent of those who voted at an advance poll. 2 percent of both those who voted on election day and those who voted at an advance poll said it took over 20 minutes to travel. 1 percent of both those who voted on election day and those who voted at an advance poll did not know how long it took them to travel.
Men were more likely to report travelling for five minutes or less (68%, versus 54% of women), while women were more likely to report travelling six to 10 minutes (34%, versus 20% of men).
Ninety-seven percent of voters said the distance to the polling station from their home was at least somewhat reasonable, with 87% saying the distance was very reasonable.
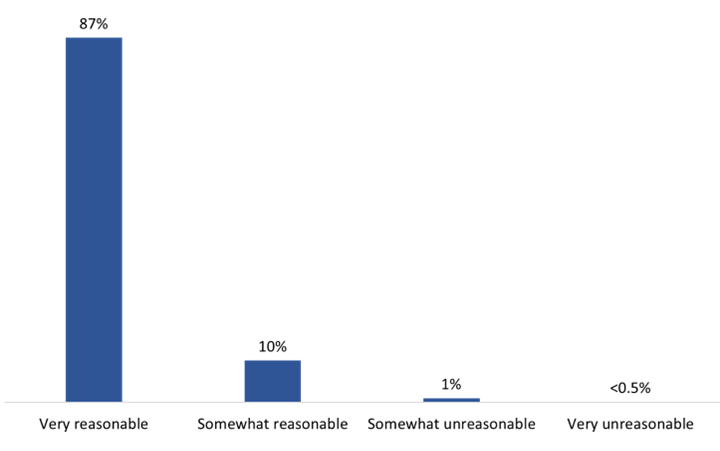
Q29. Was the [polling station/advance polling station/local Elections Canada office] a very reasonable, somewhat reasonable, somewhat unreasonable, or very unreasonable distance from your home? Base: n=236, respondents who voted in person. [Don't know: 1%].
This vertical bar chart shows the breakdown of satisfaction with the distance from the respondents' homes to their polling stations. 87 percent said the distance was very reasonable. 10 percent said it was somewhat reasonable, 1 percent said somewhat unreasonable and less than a percent said it was very unreasonable.
Men (99%, compared to 94% of women) and electors who identify as having a disability (100%, compared to 96% of those who do not identify as having a disability) were more likely to say the distance from their home to the polling station was at least somewhat reasonable.
Nearly everyone (98%) who voted at a polling station, advance polling station or local EC office said the building where they voted was at least somewhat suitable, with 86% saying it was very suitable.
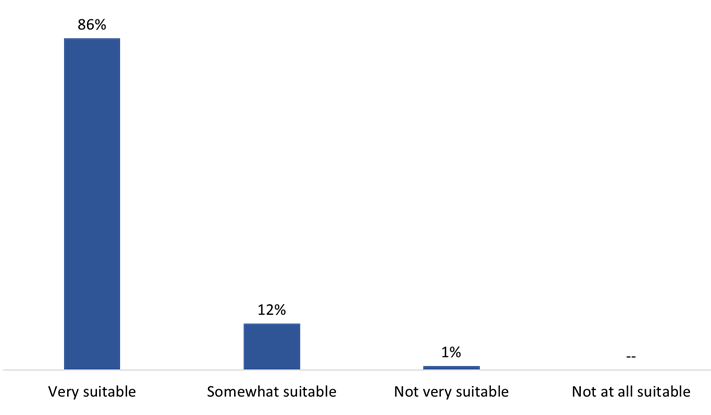
Q30. Would you say that the building where you voted was …? Base: n=236, respondents who voted in person.
This vertical bar chart shows the breakdown of the suitability of polling stations. 86 percent of respondents said that their polling station was very suitable. 12 percent said their station was somewhat suitable, 1 percent said not very suitable and no respondents said theirs was not suitable at all.
Those aged 55 and older (91%) were more likely than those aged 35 to 54 (79%) to say the building where they voted was very suitable.
Seven in 10 (69%) of those who voted in the by-election said voting took them five minutes or less, with most of the rest saying it took them between six and 15 minutes (28%). Four percent reported taking more than 15 minutes to vote. When breaking out voting time by type of poll, 73% of those who voted on election day said it took five minutes or less compared to 61% of those who voted at an advance poll. Virtually everyone (98%) said this was a reasonable amount of time.
Q31. To the best of your knowledge, how long did it take you to vote once you arrived at the [polling station/advance polling station/local Elections Canada office]? Base for the graph: respondents who voted in person on election day or at an advance poll.
This double horizontal bar chart compares the time it took to vote for those who voted on election day compared to those who voted at advance polls. 73 percent of those who voted on election day took five minutes or less to vote compared to 61 percent of those who used advance polls. 18 percent of those who voted on election day took six to 10 minutes to vote compared to 21 percent of those who used advance polls. 8 percent of those who voted on election day took 11 to 15 minutes to vote compared to 11 percent of those who used advance polls. 1 percent of those who voted on election day took 16 to 20 minutes to vote compared to 5 percent of those who used advance polls. 0 percent of those who voted on election day took 20 minutes or more to vote compared to 2 percent of those who used advance polls.
Those aged 65+ (57%) were less likely than younger voters (73%) to report taking five minutes or less to vote.
Among electors who received their VIC and voted in person (n=223), almost all (95%) said they brought their VIC with them to the voting location.
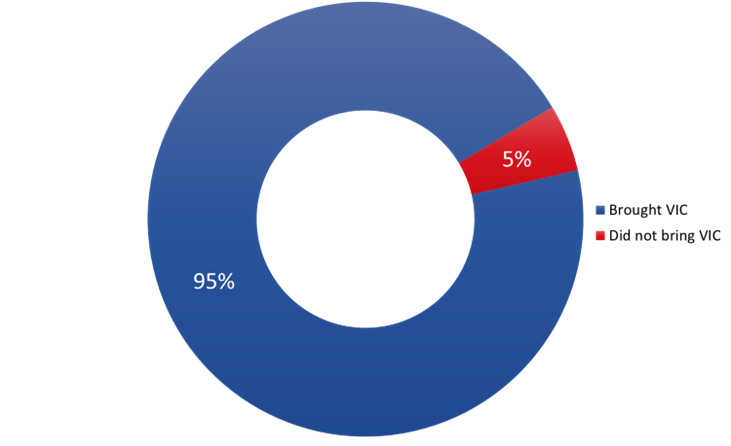
Q33. Did you bring your voter information card with you to the [polling station/advance polling station/local Elections Canada office]? Base: n=223, respondents who received their VIC and voted in person.
This pie chart shows the breakdown of those who brought their voter information card to vote. 95 percent of respondents said they brought their card while 5 percent said they did not.
Voters aged 65 and older (99%, compared to 93% of 18-to-64-year-olds) and those with a high school education or less (100%, compared to 92% of those with some post-secondary education and to 94% of those who completed university) were more likely to have brought their VIC with them when they voted.
Almost everyone who voted (97%) found it very easy to meet the identification requirements, with an additional 1% saying it was somewhat easy to meet the identification requirements.

Q. Overall, was it very easy, somewhat easy, somewhat difficult or very difficult to meet the identification requirements when you voted? Base: n=238, respondents who voted and provided a valid response when asked about the method used to vote. [Don't know: 1%/Prefer not to say: <0.5%].
This vertical bar chart shows the breakdown of the ease or difficulty meeting identification requirements. 97 percent said it was very easy. 1 percent said it was somewhat easy to vote, while no respondents said it was somewhat or very difficult to vote.
Voters who self-identified as having a disability were more likely than other voters to say it was very easy to meet the identification requirements (100% versus 96%).
The vast majority (96%) of those who said they voted in the by-election found it very easy to vote, with an additional 3% saying it was somewhat easy.

Q37. Overall, was it very easy, somewhat easy, somewhat difficult or very difficult to vote? Base: n=238, respondents who voted and provided a valid response when asked about the method used to vote.
This vertical bar chart shows the breakdown of the ease or difficulty in voting. 96 percent said it was very easy to vote. 3 percent said it was somewhat easy to vote, while no respondents said it was somewhat or very difficult to vote.
Virtually all voters said they were satisfied with the services provided by EC staff, with 93% saying they were very satisfied and an additional 4% saying they were somewhat satisfied.
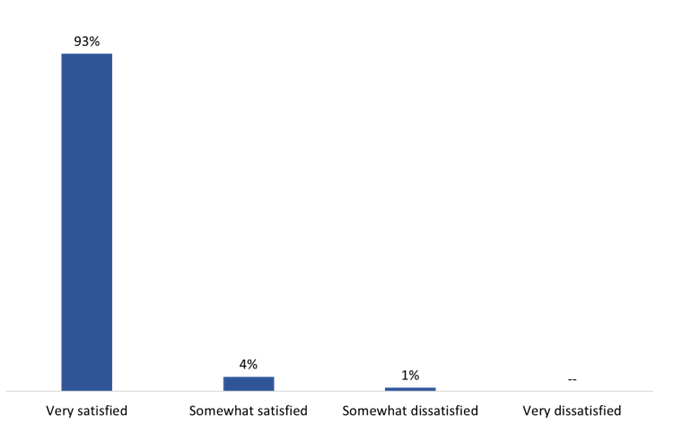
Q35. Overall, were you very satisfied, somewhat satisfied, somewhat dissatisfied or very dissatisfied with the services provided by Elections Canada staff when you voted? Base: n=236, respondents who voted in person. [Don't know: 1%].
This vertical bar chart shows the breakdown of satisfaction with the services provided by Elections Canada staff. 93 percent said they were very satisfied with the services. 4 percent said they were somewhat satisfied, 1 percent said they were somewhat dissatisfied and no respondents said they were very dissatisfied.
Ninety-eight percent of respondents who said they voted in the by-election were at least somewhat satisfied with their overall voting experience, including nine in 10 (90%) who were very satisfied with the experience.
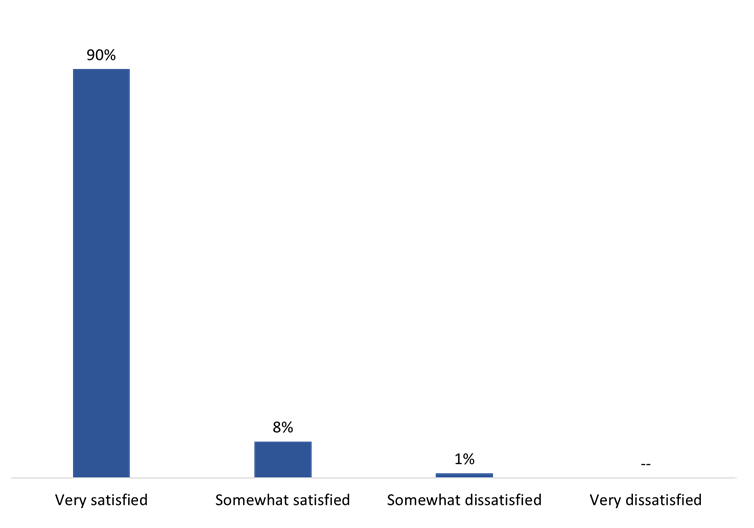
Q38. Overall, how satisfied were you with your voting experience? Would you say that you were …? Base: n=238, respondents who voted and provided a valid response when asked about the method used to vote.
This vertical bar chart shows the breakdown of satisfaction with the voter experience. 90 percent said they were very satisfied with the experience. 8 percent said they were somewhat satisfied, 1 percent said they were somewhat dissatisfied and no respondents said they were very dissatisfied.
Just over two thirds (68%) of electors surveyed thought that EC ran the by-election fairly, with the majority (57%) saying very fairly and 11% saying somewhat fairly. Among the rest, 6% thought it was run unfairly, and one in four (24%) responded that they did not know.
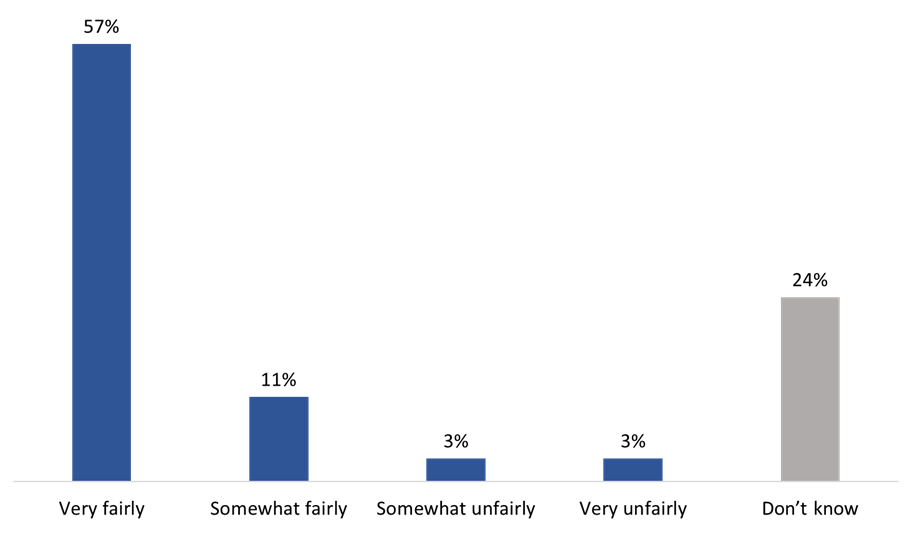
Q39. Thinking about the March 4 federal by-election, would you say that Elections Canada ran the election ...? Base: n=402, all respondents. [Prefer not to answer: 1%].
This vertical bar chart shows the respondents' perceptions of fairness in the Durham by-election. 57 percent of respondents thought the election was very fairly run. 11 percent of respondents thought the election was somewhat fairly run, while 3 percent said somewhat unfairly, 3 percent said very unfairly and 24 percent did not know.
Electors aged 18 to 34 (49%) were less likely than electors aged 55+ (64%) to say that EC ran the by election very fairly.
Those who felt that EC ran the election somewhat or very unfairly (n=24) were asked whether there was a specific reason for this opinion. The reason mentioned most frequently was a perceived lack of information about the by-election.
Almost nine in 10 respondents (88%) had trust in the accuracy of the election results, with nearly six in 10 (58%) expressing a very high level of trust.
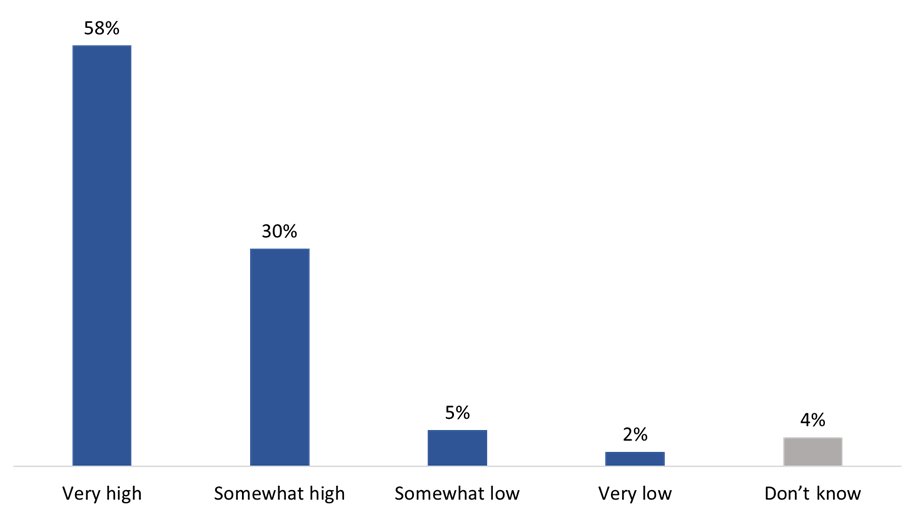
Q41. What level of trust do you have in the accuracy of the election results in your riding? Is it …? Base: n=402, all respondents.
This vertical bar chart shows the respondents' trust in the accuracy of the Durham by-election results. 58 percent of respondents had very high levels of trust in the results. 11 percent of respondents had somewhat high levels of trust in the results, while 5 percent said somewhat low, 2 percent said very low and 4 percent did not know.
The following electors were less likely to have a very high level of trust in the accuracy of the election results:
Those who said that they have low trust in the accuracy of the election results (n=27) were asked whether there was a specific reason for their low trust. In response, most respondents pointed to a general distrust of government and politicians, concerns related to the electoral process and lack of information about the by-election.
Return to footnote 1 EC does not run ads on television or use telephone calls or in-person campaigning to advertise by-elections. In addition, a portion of the responses in the "other print" and "outdoor signage" categories may represent advertising from non-EC sources, such as candidates.
Return to footnote 2 This includes voting at a polling station on election day, at an advance polling station or at a local EC office.